Teaching Environmental Sustainability: Model My Watershed Teacher Guide 2017-2018
Table of Contents
- Introduction
- Walkthrough: How to use the WikiWatershed.org Runoff Simulation
- Walkthrough: How to Use the Site Storm Model (Model My Watershed (MMW) App)
- Activity 1 - Exploring Water in Your Schoolyard (view activity)
- Activity 2- Conservation Practices in My Watershed and Schoolyard (view activity)
- Activity 3 - Tracking Water in My Schoolyard (view activity)
- Activity 4 - Effects of Land Cover & Soils in Watersheds (view activity)
- Activity 5 - Modeling Improvements to My Schoolyard (view activity)
- Supplementary Activities
- Water Scientist Videos
- Vocabulary
- Unit Alignment to Next Generation Science Standards (NGSS)
Unit
Watershed
Subject
Environmental Science and Earth Science
Grade Level
MS/HS
Introduction
The Teaching Environmental Sustainability - Model My Watershed (TES-MMW) curriculum unit was designed for students to learn systems thinking and geospatial analysis skills in the context of place-based problem-solving for watershed science. It includes a base set of five learning activities along with a few extension activities for further study. The activities were written with 9th grade Earth Science and Environmental Science classes in mind and are designed to be easily customized in the Innovative Technology in Science Inquiry (ITSI) platform. Teachers can add, delete, expand, reorder, and modify activities to tailor them to their instructional objectives, student abilities and prior knowledge, and school context. Teachers may find it appropriate to include a discussion or activities before beginning the unit that introduces their students to foundational understandings of watershed concepts. Unit vocabulary can be found near the end of this teacher’s guide.
TES-MMW is a guided inquiry-based unit that includes scientific literacy, modeling, data analysis, an outside schoolyard investigation, and extension activities. Students will make observations, collect environmental data, and create and analyze geospatial mapping scenarios. The curriculum includes the use of mobile technology in the form of a digital probe with a tablet, iPad, or smartphone and online geographic information system (GIS) tools. The online Micro Site Runoff Model is a simulation of a parcel of land that allows users to change land cover, soil types, and rainfall amounts to determine hypothetical changes in evapotranspiration, infiltration, and runoff rates. The Model My Watershed app is a watershed-modeling GIS web app that enables citizens, conservation practitioners, municipal decision-makers, educators, and students to analyze land use and soil data, model stormwater runoff, and compare different conservation or development scenarios that could modify runoff and water quality. Model My Watershed uses real scientific data from national databases.
Prior to the start of your unit:
Accessing and Using the ITSI Portal
Before beginning day 1 of this 5 day unit, you will need to log on to ITSI Portal and create a class.
- Once your class is selected, click the EDIT button to add activities to your class.
- The Model My Watershed Activities are located under the "High School Environmental Science" activity page.
- Select the appropriate modules you would like added to your class, by clicking the box next to each module.
- Once all modules are selected, click the "Save this class" button.
You must repeat these steps for each of your classes prior to students logging on.
- Once you save your class you can preview what your students will see when logging in, by clicking the "Preview" button.
It would be best to have students, create accounts and log in to explore the ITSI portal prior to beginning the Model My Watershed curriculum.
* When students create their account, they should record their username, that is generated for them by the ITSI portal, and password in a known location so they can access it easier. There is the ability for teachers to see the username of a student and to change a password if a student forgets.
If you need assistance, use the tutorials located in the Help section of the ITSI portal.
- The MMW app and the Micro Site Runoff model are both embedded into the Watershed activities in the ITSI portal.
- Please refer to the Walk Throughs below for each of these tools to learn more about the models and how to use all of the features. Additional help information about using these tools along with recorded webinars can be found in the help section of WikiWatershed.org.
Walkthrough: How to use the WikiWatershed.org Runoff Simulation
The WikiWatershed.org Runoff Simulation which applies the TR-55 runoff model developed by the US Department of Agriculture and the Small Storm Hydrology Model for Urban Areas developed by Robert Pitt for a single 24-hour rain storm over a hypothetical small unit of land with a single land cover class and a single hydrologic soil group. The Runoff Simulation performs the same model calculations that the Model My Watershed Site Storm Model does for a selected land area within the continental United States by using actual land cover and soil data for the selected land area. As a result, the Runoff Simulation is an effective learning tool to prepare users to understand the impact of land cover and hydrologic soil type changes to evapotranspiration, infiltration, and runoff amounts from a 24-hour storm event.
The Runoff Simulation is available online through the Innovative Technology in Science Inquiry (ITSI) portal or in any web browser at wikiwatershed.org. When you run the full Model My Watershed Storm Model application, the exact same calculations are happening on every single pixel of the map and are being added together to calculate what is happening for a whole map area. Please note that although the look of the graphics of the simulation may have changed from the time this walkthrough was created, the placement and functionality of the controls will not change.
As a simplified simulation, there are only a few controls to manipulate. At the top right is a slider where you can adjust the level of rainfall within 24 hours from a small rainstorm (equivalent to 1 cm of rain) to a hurricane (21 cm of rain). As you adjust the slider from left to right the rainfall increases. The amount of rainfall is shown on the box on the upper left.
Below the rainfall, you can select the land cover type. These land cover types and the general color scheme are taken directly from the National Land Cover Database made by the U.S. Geological Survey. A help bubble describing each land cover type will appear as you hover over that land type.
On the lower right, you can also select the hydrologic soil group. These four hydrologic soil group were defined by the U.S. Department of Agriculture in 1955. Soil scientists group all soils in the U.S. into one of these four groups based on how the soils absorb and transmit water. There are also help bubbles here describing the soil types.
As the parameters are selected on the right part of the screen, the infographic on the left changes. It will always show a simulated cube of land with the selected land cover on top and the soil type on the sides. In the upper left corner of the infographic is a box with the amount of rainfall listed. The other three corners of the infographic show the amount of rainfall that will end up as evapotranspiration (ET, water that immediately evaporates or is taken up by plants), runoff (R, water that flows across the land surface), and infiltration (I, water that seeps into the soil). Arrows coming out of the block in the infographic change size as the amount going into each component increases. The size of the arrows is proportional to the amount of rainfall; larger rainfall amounts will always lead to larger amounts of water coming out and thus bigger arrows. To the right of the cube of land is a bar graph showing the distribution of water. This bar graph shows the percent of water going into each category (ET, I, or R). The size of the bar graph is the same for every storm size. If more than 5 cm of rainfall will become runoff, an exclamation point will appear at the top of the bar graph. The colors of the bar graph match the colors of the arrows and the colors of the numbers in the text boxes.
A few more notes about using this simulation: First, it is possible that the sum of the amount of infiltration, runoff, and evapotranspiration will not add up to exactly the total rainfall. This is due to rounding in the model. This simulation and underlying model is also not predicting flooding; it is only predicting the distribution of water between infiltration, runoff, and evapotranspiration on a land surface. A true flooding model is much more complicated. To predict flooding you need a great deal of detail about the whole landscape and years of historical weather and flooding data. The Runoff Simulation is only a simplified way of demonstrating the effects of different land cover and soil types on water distribution.
Walkthrough: How to Use the Model My Watershed Site Storm Model
The online GIS-based Model My Watershed Site Storm Model works best on desktop and laptop computers. It is also optimized for the Firefox browser. MMW works on touch-screen devices such as iPads, other tablets, and laptops with dual keyboard and touch-screen functionality but users may experience some issues with overlapping formatting of tools due to screen size and touch-screen sensitivity.
The Model My Watershed (MMW) Site Storm Model simulates storm runoff and water quality by applying the TR-55 and STEP-L water quality models for a single 24-hour rain storm over a selected land area within the continental United States. The results are calculated based on actual land cover data (from the USGS National Land Cover Database 2011, NLCD2011) and actual soil data (from the USDA Gridded Soil Survey Geographic Database, gSSURGO) for the selected land area of interest. The complementary WikiWatershed Micro Site Storm Model performs the same model calculations on a hypothetical land parcel with a single land cover class and a single hydrologic soil group.
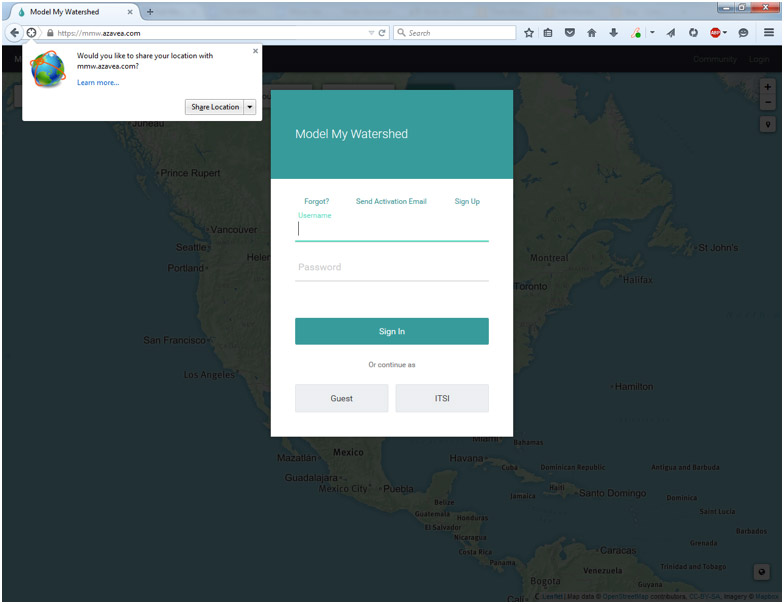
The MMW Site Storm Model can be accessed online from any web browser at Innovative Technology in Science Inquiry (ITSI) portal or through any web browser in wikiwatershed.org. When you first navigate to the MMW application, depending on your browser's settings you may be asked to share your location data with the application. Sharing your location will automatically start the application at approximately your current location, but is not necessary for the application to work. You will also immediately be given a chance to sign in to the application. Signing in allows you to save your work to return to later and to share your work with other users. For users who have registered on the site before, simply type in your username and password and click "Sign In." New users can create a sign in by clicking "Sign Up" in the upper right. For students and teachers who are using the Innovative Technology in Science Inquiry (ITSI) portal, click the "ITSI" button. This will verify your credentials for the ITSI portal and prevent you from needing to set up a new user for the application. This also allows you to quickly and easily send data and screenshots back and forth to assignments and lessons on the ITSI portal. For anyone who does not need or want to save data, you can simply click the “Guest” button and continue without any credentials. Logging in as a guest gives you access to the full modeling and scenario capabilities of the application, but will you not be able to save and share any data or easily send it to the ITSI portal.
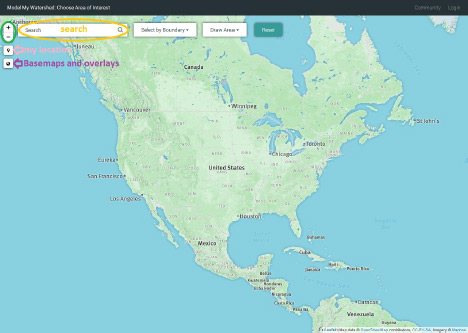
Once you have logged into the application, you will see a map looking much like Google maps. If you shared your location, the application may zoom directly to your location, otherwise it will begin by showing a map of the entire lower 48 states of the U.S. As with most online map tools, you can navigate the map by clicking and dragging and zoom by pinching, using a scroll wheel, or using the zoom buttons on the lower right. You can also search for a location by name or address using the "Search" box on the upper right. To go or return to your current location, hit the “My Location” button with a picture of a pin next to the zoom buttons on the lower left.
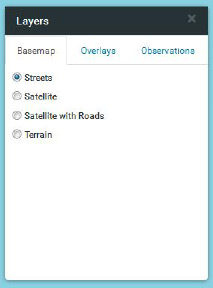
Just as Google maps allows you to switch between road and satellite maps, there are several options for both the base map and data overlays on top of the map. Use the "Basemaps" tab of the "Layers" control box to access these. You can select a basemap image and several different types of overlays. The base maps themselves come directly from ESRI or Google Maps and are not built into the application. If you have a very slow Internet connection, the base maps may be slow to load. The overlays include boundary lines (like school districts and USGS hydrologic units) and color shading for land uses and soil types.
The other tables in the "Layers" control box are for displaying streams, coverage grid, boundary, and observations overlays. Continental US medium resolution stream network, Delaware River Basin high resolution stream network along with other stream overlays are enabled via the "Streams" tab. The Continental US and Delaware River Basin stream network overlays are zoom dependent. Smaller streams are shown as you zoom in.
In the "Coverage Grid" tab of the "Layers" control box you can enable color shading of the USGS National Land Cover Database, the USDA Hydrologic Soils Groups, and other data. A slider tool allows you to adjust the transparency of the color shading.
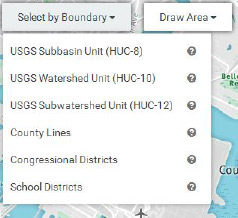
Boundary lines can be added in the "Boundary" tab of the "Layers" control box. You can add boundaries (lines show up in pink) for USGS Subbasin units (HUC-8, HUC-10, HUC-12), county lines, congressional districts, school districts, and municipalities (PA only).
Additional watershed data is available in the "Observations" tab of the "Layers" control box. These data include USGS and other national river and weather monitoring stations. Please note that observation data is not available in all locations!
Click on "Get Started" to begin modeling and viewing additional data.You next select the type of area you would like to study and model. The first option is to "Select a boundary" area, with the same boundary options as you saw in the "Layers" control. Additional in this "Select a boundary" tool once you select a boundary you can then see the name of the defined areas when you hover over the map. Be aware of your zoom level when selecting by boundaries. If you are at too high of a zoom level, you may not be able to see the boundaries on your map. Your second choice is to "Draw area" with the options of free drawing a polygon of any size and shape you choose or drawing a 1 square Km area to model. Your third option is to "Delineate watershed". To use this option you place a point (purple circle) anywhere on the map you choose. The function finds the most direct point (blue circle) down slope where water would runoff into a body of water. From the blue point it then finds the watershed boundary of all land surfaces that would drain to that point. The last option is to "Upload file" in which you can upload a shapefile from another GIS program.
As soon as you have selected an area or closed the box of your custom area the application will change into geospatial analysis mode. The right side of the screen will now show the area you selected in bright colors with the rest of the map greyed out. The left side of the screen will show the "Analyze" pane. The "Analyze" pane contains land cover distribution, hydrologic soil group distribution, county-based estimated number of farm animals, permitted point source discharges, water quality data. These calculations and analyses are done on the fly for each area based on nationally available data. You will not get some pre-computed estimate or “canned” number. These are real values based on the most recently available national land cover, soil type, and other datasets. Because of this, the analysis may take a few seconds to complete and you may see a loading wheel as this happens. (It is generally very fast with a good Internet connection.)
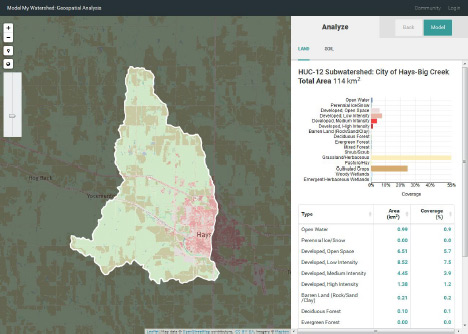
In the analyze pane, you can view the land use, soil type, and other data in both tabular and graphical form. (The table is below the graph. If you cannot see it, scroll down.) Use the tabs at the top of the pane to switch between data types. You can sort the tabular data by type, area, coverage percent, and other units. The bar graph coloring in the land cover distribution matches the colors assigned by the National Land Cover Database and the bar graphs can be used as legends for the land cover and soil group overlays.
The title at the top of the analyze pane will list the name of the area (if selected by boundary) and the total size of the area. You can still change the map zoom and overlays in the map pane. Try turning on the NLCD overlay to compare the layout of land covers on the map to the percent of each land cover in the area. To see a larger area of the map and minimize the analyze pane you can click on the expand/contract map arrows button near the zoom button in the bottom right of the map.
If you realize you made a mistake in selecting your area, hit the "Change area" button at the bottom left of the analyze pane. You will be taken back to the "Select Area" screen. To clear the map and start over completely at any time, click the "Model My Watershed" title at the top left of the screen. If you are happy with the area you selected, you can move on to modeling and modifying the area by clicking the teal "Select a model" button on the bottom of the analyze pane then selecting from the options. The "Site Storm Model" choice models changes for a single storm event. Users of the NSF-TES MMW curriculum should select "Site Storm Model" for their activities. The other choice, "Watershed Multi-Year Model" shows users additional modeling results over longer spans of time.
Once you have entered the modeling mode, the application will show runoff and water quality data for the current conditions. The runoff quantities are calculated using a combination of the TR-55 runoff model developed by the US Department of Agriculture and the Small Storm Hydrology Model for Urban Areas developed by Robert Pitt for a single 24-hour rain storm. The water quality parameters are calculated using the EPA's STEP-L water quality model. For more information on the specifics of these calculations, see other documentation at WikiWatershed.org. The runoff tab shows the partitioning of the rainwater into runoff, infiltration, and evapotranspiration as a stacked bar graph. In the water quality tab, you will see both tabular and graphical data showing predicted water quality for any streams in the selected area. Because the model is running with real data on your custom area, it may take some time for the model to run and you may see a loading icon. (It is generally very fast with good internet connection.) The 24-hour rain event model is set for 2.50 cm by default but can be changed using the slider near the top right of the map.
New scenarios, in which you can modify the landscape by changing the land cover type or applying conservation practices can be modeled by first selecting "Add changes to this area" button in the top right corner. At first, this "New Scenario" map and data look exactly like the current conditions map but with two new tool boxes above the map, one for "Land Cover" and another for "Conservation Practices". Each of these is a free-hand drawing tool to modify the current land use. The model output pane also changes to show the original results from the "current conditions" tab and the modified results as you change the landscape. Select a land use or conservation practice from the toolboxes at the top of the screen and then click points on the map to draw an area over which to apply it. As soon as you add a new land use or conservation practice, the model will re-run in the background to calculate what has changed and all of the plots will be updated. You will see loading icons again in the model pane as this happens. Remember that you can expand/contract the map pane to give more screen space to work on landscape modifications. See other documentation for an explanation of how the runoff and water quality contributions of conservation practices are calculated.

As you add modifications, you can see details about amount of area modified by clicking on any modification box. You can also see a list of all of the modifications you made in the scenario by clicking on the space in the upper right of the map pane where it says “x modifications.” This gives a sort of “shopping cart” of modifications grouped by the type of modification. You can delete any modification by clicking the trashcan next to it. If it helps to decide where to make changes, you can still use the "Layers" control box to select which overlays to display on the map.
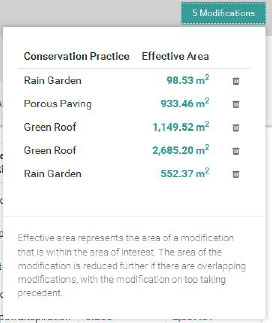
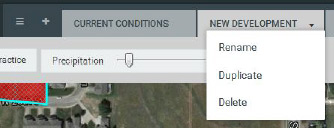
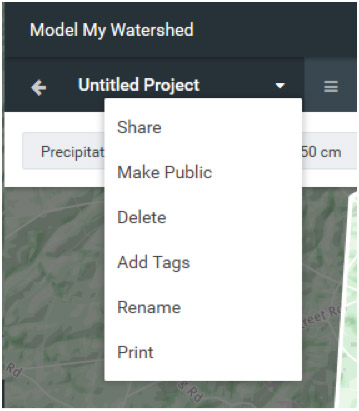
You can create many possible scenarios of landscape modification by clicking on the "+ New Scenario" next to the drop down list of current conditions and scenarios. This opens up a new scenario with no modifications on it. Scenarios can be renamed by clicking the three dots "…" next to the scenarios in the scenarios drop down list. You can also rename your entire project by clicking the small down arrow next to the "Untitled Project" text in the top left corner and, if you are logged in, share your project through the same menu. If you have made your project publicly accessible and given someone the link, they will be able to view all of your scenarios and results. They will not, however, be able to modify it. Any public project can be made private again from the same menu.
Once you have created several scenarios, you can compare all of them by clicking “Compare” in the upper left. This gives a side-by side comparison of all of the scenarios along with the original conditions before any modifications. It also shows what the partitioning would be if the landscape were 100% forested. This 100% forested condition will give the maximum amount of infiltration for the landscape, given its soils. At the top is a map showing the original area and modifications. Below that you can select which type of model output you would like to compare (runoff or water quality). The same model will apply to all scenarios. At the bottom of the screen there is a list of all the modifications made in each scenario. To scroll through many scenarios, use the "Navigate Scenarios" arrows on the bottom right of the screen. To return to your scenarios, click the "Back" arrow in the bottom left of the screen.

ACTIVITY 1 - EXPLORING WATER IN YOUR SCHOOLYARD
In this activity students are introduced to conservation practices that can be placed on schoolyards. Students also tour their schoolyard to identify areas on a map that are pervious and impervious.
Being Prepared
Students will enroll in your class in the ITSI portal by using the class word before beginning Day 1.
If you need assistance, use the tutorials located in the Help section of the ITSI portal. The ITSI portal contains lesson materials needed for students to engage in this activity.
This activity can be led by the teacher as a whole class activity or if computers are available for all students or groups of students they can progress through the activity at their own pace until it is time to go outside as a class.
You will use a 1 square Km map from MMW to identify features of your schoolyard. Follow these procedures to create a 1 square Km schoolyard map using MMW then print this map for each student or group of students. Students will use this 1 square Km map in activities I and III.
- Launch the Model My Watershed Application (Click the ITSI button to log on.) to obtain a 1 square Km map of your schoolyard.
- In the “Search” field, type in the address of your school.
- In the "Layers" controls change the "Basemap" menu select “Satellite”.
- Select "Get Started" to create your schoolyard map.
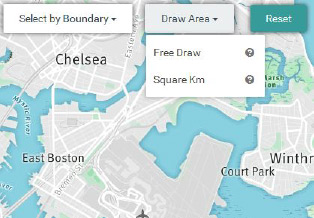
- In the “Draw Area” function select “Square Km”. Place the marker over your school to create a 1 square Km map with your school in the center.
- Take a screenshot of the map and print one for each student or group of students.
Background
Before beginning part one, students should have prior knowledge of the water cycle, including the terms: Evapotranspiration, Runoff, Infiltration, Precipitation, Evaporation, and Condensation. Students should have a background in point source and nonpoint source pollution and a basic understanding of a watershed. All land is comprised of watersheds. Smaller watersheds are nested within larger ones. The largest watershed in the US is the Mississippi River watershed. It is comprised of other large watersheds, such as the Ohio River and the Missouri River watersheds. Each of the smaller watersheds is also comprised of smaller ones, until you get down to “first order” watersheds, where the water drains off of nearby slopes into the stream channel. There are many more miles of first-order watersheds than there are of larger (higher order) watersheds.
Suggested Timeline
The activity is designed to be completed in a 50 minute period.
Introduction
The introduction of this activity engages students with an essential question and then provides a brief explanation of major topics in the lesson.
Essential Question: What areas of your schoolyard are pervious and impervious and how can conservation practices improve your watershed?
Standards
NGSS Standards
- Disciplinary Core Ideas: ESS2.C The roles of water in Earth's surface processes, ESS3.C: Human impacts on Earth's systems.
- Science & Engineering Practices: Analyzing and interpreting data, engaging in argument from evidence.
Learning Objectives
- Students will identify buildings and land areas as pervious and impervious.
- Students will identify green building and conservation practices that improve a watershed by increasing infiltration and decreasing runoff.
- Students will propose conservation practices to improve the impact of their school site on their local watershed.
Materials
- For this activity the teacher may lead the activity using a computer and projector or each student will need access to a computer or tablet. (**If necessary, students can work in pairs. In pairs, one student will log on to ITSI and "invite" the other student to join. This will create a group logon and each student will have their activity information filled in once they hit submit.)
- It may be beneficial for you to print out Part 1: Exploring Water in Your Schoolyard from the ITSI portal. To do this, click the “print” button in the top right corner of the page.
- Students or groups of students will also need a 1 square Km map from MMW centered on their schoolyard.
Safety
Be careful not to disturb any wildlife or plants while exploring your schoolyard. If you are near or entering a wooded area, dress appropriately and be cautious of poison ivy and/or ticks.
Collect Data I
In this first section students will be introduced to major vocabulary terms in the unit then watch a short video of how one location in KY has implemented conservation practices and green sustainable building practices.
Q: Identify one of the conservation practices that were used in the Visitor Center at the Bernheim Arboretum and Research Forest, KY? How does it decrease the amount of water runoff and improve water quality?
A: Answers will vary. Students may identify fungus to clean water off from parking lot, wastewater treatment, green roof, rainwater capture in cistern reused to flush toilets, and French drains or dry sinks to allow water to soak into the ground as conservation practices from the video. These conservation practices promote water infiltration or reuse to slow down water runoff, decrease amount of runoff, and improve water quality.
Collect Data II
In the second section of this activity students watch another short video to learn how a city school in PA implemented conservation practices.
Q: Identify one of the conservation practices that were used in the Greenwood Elementary School in Philadelphia, PA? How does it decrease the amount of water runoff and improve water quality?
A: Answers will vary. Students may identify removal of some of the impervious asphalt and direction of water to infiltration areas, edible gardens, rain gardens, porous play surfaces, green roof, shade areas, grey water reclamation system using water from roof to flush toilets, using green products for cleaning, and planting trees as conservation practices in the video. These conservation practices were designed as a stormwater management project to reduce combined sewer overflows into the river.
Collect Data III
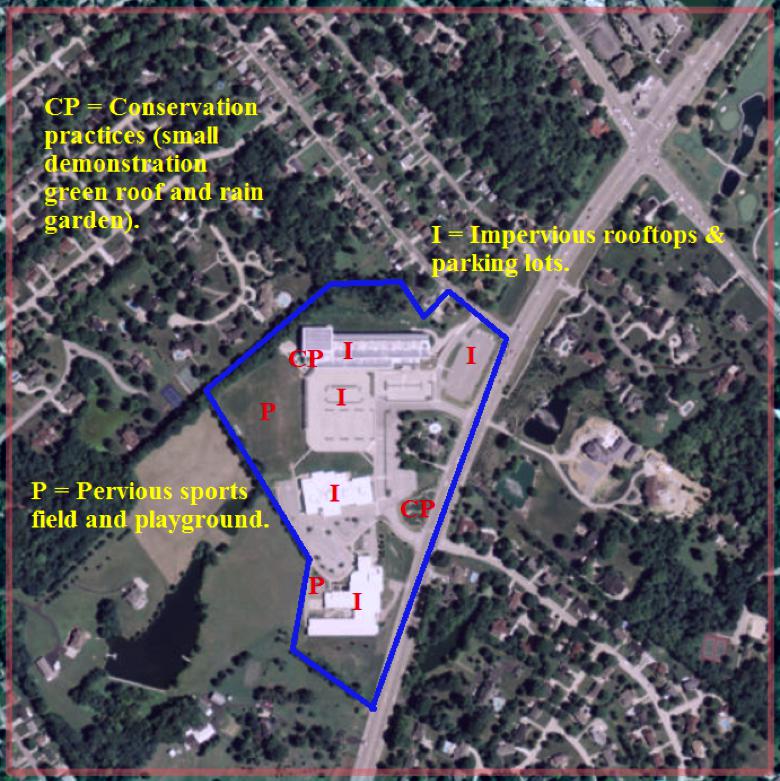
Students will create a 1 square Km map of their schoolyard from MMW. Teachers may choose to do this ahead of time and print copies of the maps for their students. Students will then mark the outline of their school property, impervious surfaces, pervious areas, and other land features during their tour of their schoolyard. Included here and in the online activity is an example 1 square Km map of a school in northern Kentucky.
While outside the teacher will also demonstrate water infiltration and runoff in pervious and impervious areas that students identify. This simple demonstration of pouring a bucket of water on each of these areas shows how water infiltrates into pervious areas and runs off or make puddles in impervious areas.
Q: After one minute of observing the water poured onto the area you predicted to be pervious: What approximate percentage of water was runoff (or remained as a puddle)? What approximate percentage of water infiltrated into the ground?
A: Approximate percentages of water runoff and infiltration in the pervious area will vary. More of the water should infiltrate into the ground than runoff in pervious areas.
Q: After one minute of observing the water poured onto the area you predicted to be impervious: What approximate percentage of water was runoff (or remained as a puddle)? What approximate percentage of water infiltrated into the ground?
A: Approximate percentages of water runoff and infiltration in the impervious area will vary. More of the water should runoff or remain as a puddle than infiltrate in impervious areas.
Analysis
Q: Which land areas or buildings on your school property are pervious? Why is infiltration important for the health of your watershed?
A: Answers will vary. Students should identify pervious areas such as fields, wooded areas, rain gardens, green roofs, porous pavers, etc. Infiltration of water is important because it slows down the flow of water, decreases the amount of water the flows over land, and cleans water before it enters streams.
Q: Identify locations in your schoolyard that are impervious. What new conservation practices could be added to your schoolyard to increase infiltration at these sites?
A: Answers will vary. Students should identify impervious areas such as concrete, asphalt, roofs, sidewalks, basketball courts, tennis courts, etc. Students may suggest conservation practices that they learned about in the introduction videos to be added to their schoolyard to increase infiltration.
Conclusion
Q: What effect do you believe new sustainable building and conservation practices will have on your watershed?
A: Additional green building and conservation practices will slow down the flow of water, reduce runoff, increase infiltration, and decrease the amount of pollutants in the water (both chemical and soil erosion).
Concluding Career STEM Question
Water Resource Specialist
Q: What is an example of a watershed emergency that water research specialist might need to address?
A: Water research specialists would need to plan for and address emergencies such as large storm events (thunderstorms and hurricanes) with heavy rain, sudden spring snow melt, water main breaks in pipes, pollutants in the drinking water supply, and chemicals spills from trucks, trains, or pipelines.
Further Investigation
This extension activity is suggested to be placed at the end of Activity I or may also be used at the end of the 5 day unit. Students research installation costs vs. return on investment of conservation practices and sustainable building features and develop a plan to create the largest positive impact for their school.
ACTIVITY 2 - CONSERVATION PRACTICES IN MY WATERSHED AND SCHOOLYARD
In this activity students will learn about watershed and conservation practices and explore a map of their local watershed.
Being Prepared
You will continue your local watershed study by exploring a map of your community (map from Model My Watershed).
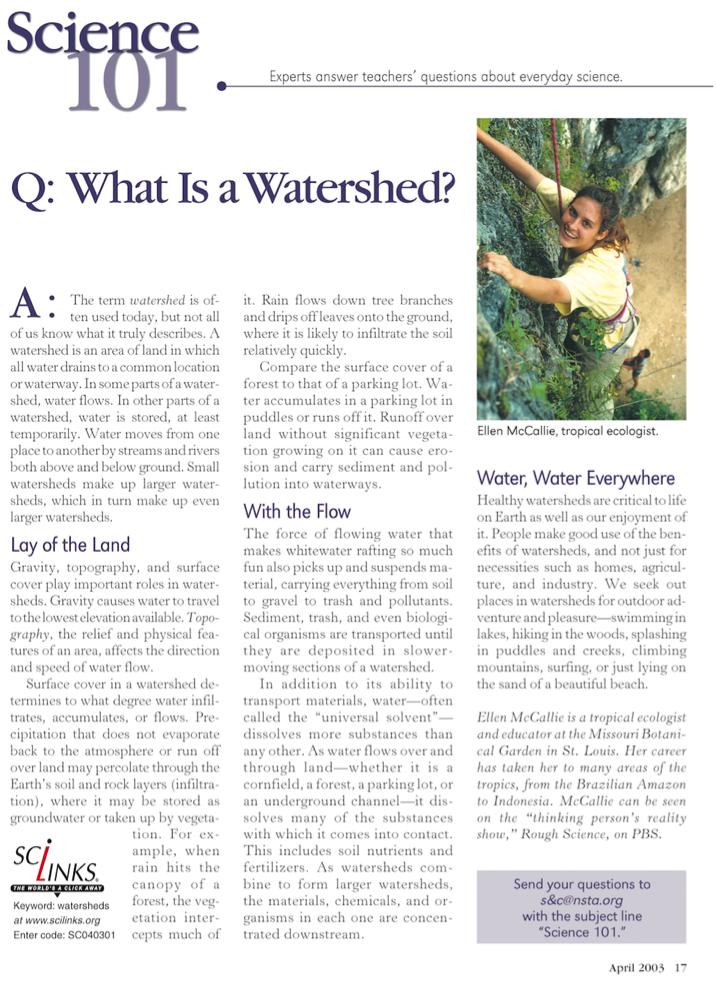
The teacher may lead this activity as a whole class using a computer and projector or if the students work independently they will need access to a computer for this activity. They can launch the MMW application directly through the ITSI online activity. The "Science 101 What Is a Watershed?" article is embedded into the online activity as an optional reading resource. It can also be printed for students to read.
Background
A watershed is the area of land that water flows over to reach a river, lake, or a stream. Near the upslope edges of a watershed, small tributary streams (1st, 2nd and 3rd order) begin gathering water that flows further downstream into larger rivers and eventually drains into a river, bay, or ocean. Some of this water also soaks deeper into the ground joining groundwater aquifer storage areas that are important drinking water resources.
Conservation Practices in MMW
Rain garden - Rainwater that falls on the land drains into a specific place, a rain garden, where it soaks into the ground. It is usually small and is built in residential yards. It has plants that like wet soil and keeps the water from polluting streams and rivers, since soil helps to clean water. Without a rain garden, water runs off of the surface and it can carry mud and pollution into streams and rivers.
Vegetated infiltration basin – This is like a rain garden but much bigger. It does the same thing, makes the water soak into the ground. They are built in large developments, such as schoolyards and shopping malls. The plants that live there like wet soil and help it soak into the ground.
Porous paving - This is a way to have an area where cars can park but still let water soak into the ground. Below the surface blocks, they have gravel that lets the water soak in. Because of the gravel, there is room under the parking area for the water to stay until it soaks into the ground.
Green roofs - Green roofs have plants growing on them. They keep the rain from running off the building and causing flooding and erosion. The plants soak up the rain and put it back into the atmosphere through evapotranspiration.
No-till agriculture - The farmer plows fields and plants crops without removing the plants that are already there. Like the other CPs, it keeps the water from running off of the field and taking mud and chemicals into the streams and rivers. The water that soaks in makes it better for the crops to grow. It also keeps weeds out of the field.
Cluster housing – When developers build a community, they can build the houses closer together and leave other areas open and undeveloped where they plant trees and other plants that will soak up the rain. This reduces flooding and lets water soak back into the ground.
Suggested Timeline
The activity is designed to be completed in a 50 minute period.
Introduction
The introduction provides information about the major topics in the unit including watersheds and conservation practices.
Students are prompted by the essential question: Does my school and community implement conservation practices and how does the presence or absence of conservation practices impact my watershed?
Students can then watch a short video entitled, “What is a Watershed?’.
An optional short reading is also included in a web link to learn about more about watersheds (Science 101 - What is a Watershed?).
Download a PDF of "Science 101 - What is a Watershed?" for printing here.
Standards
NGSS Standards
- Disciplinary Core Ideas: ESS2.A Earth's materials and systems, ESS2.C The roles of water in Earth's surface processes, ESS3.C Human impacts on Earth systems.
- Science & Engineering Practices: Using models, analyzing and interpreting data, constructing explanations, engaging in argument from evidence.
- Crosscutting Concepts: Cause & effect.
Learning Objectives
- Students will identify and describe their local watershed.
- Students will identify various conservation practices in their watershed.
- Students will explain how the land that makes up a watershed is connected and how the actions of one member of their watershed impact all other members of the watershed.
Materials
- Students will need a large map of their local watershed. Procedures for creating the map are provided below.
Safety
None
Procedure
Map of your local watershed. Follow these procedures to create a local watershed map using app.wikiwatershed.org:
- Launch the Model My Watershed Application in the Collect Data I/Model section below. (Click the ITSI button to log on.)
- In the “Search” field, type in the address of your school.
- In the "Layers" control box "Basemaps" tab select “Satellite with Roads.”
- Select "Get Started" to create your local watershed map.
- Click the drop down bar labeled “Select by Boundary” and select “USGS Subwatershed Unit (HUC-12)" to identify the watershed (also referred to as a drainage basin) your school is located in. Zoom out to see the entire watershed. Watershed boundaries are shown with a thin red line. As you hover over different watersheds the name of the watershed appears next to your pointer.
- Double click on the location of your school. Land, soil, and other data about your watershed are now presented on the right side of the screen. Within the highlighted region you may need to continue to zoom in or out to see features.
Example USGS Watershed Unit (HUC-12) Boundary Map of Lower Banklick Creek Subwatershed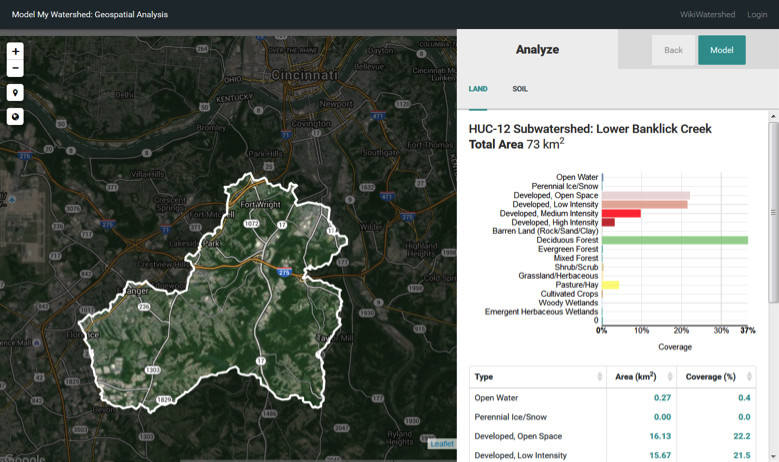
Collect Data I
Students will participate in a class discussion to locate and identify the following features on your community map.
- Your school’s location on the map.
- Natural and man-made features on the map such as streams, lakes, forested areas, farms and open spaces, residential areas, businesses, or industrial areas, etc. Can you name the streams in your local area that flow into or out of your schoolyard or which stream has water flow into it from your schoolyard?
Q:What is the name of your watershed and what is the total area of it in square kilometers?
A: Will vary based on your school location. Can be found on the right side of the screen such as Lower Banklick Creek in the example above.
Collect Data II
Students are introduced to six common conservation practices, also known as best management practices (BMPs), which reduce runoff, promote infiltration, and minimize pollution in streams. Students then examine their watershed map to identify six watershed neighbors, 3 that are upstream from their school, 3 that are downstream from their school, if those neighbors have a conservation practice in place and if so which one, and the impact of each neighbor on the watershed. Students complete the following data table.
Table 1: My Watershed Neighbors
| Upstream Watershed Neighbors | Conservation Practice | Impact on Watershed |
|---|---|---|
| Downstream Watershed Neighbors | Conservation Practice | Impact on Watershed |
Analysis
Q: Summarize from your table above how your neighbors are affecting your watershed. (Hints: Do they have pervious or impervious areas that increase infiltration or runoff? Do they have conservation practices that increase infiltration?)
A: Answers will vary. Students should mention that neighbors will large pervious land surfaces are helping the watershed by promoting water infiltration. Neighbors that have large impervious surfaces are hurting the watershed by creating runoff which can carry pollutants and soil into streams and cause flooding and erosion of the streams.
Q. What new green sustainable building or conservation practices could be installed on your schoolyard to improve the health of your watershed?
A: Answers will vary but students may propose green roofs, rain gardens, porous pavement, natural outdoor classrooms, rainwater catchment basins or tanks, waterless urinals and low-flow fixtures, composting toilets, bioswales, use of natural and mineral based cleaning products, water bottle refill stations, planting trees for shade area and water uptake, edible gardens, more sustainably designed LEED certified buildings, etc.
Q. What new green sustainable building and conservation practices could be installed in your watershed to improve the health of your watershed?
A: Answers will vary but students may propose green roofs, rain gardens, porous pavement, no-till or other conservation farming practices, natural recreation areas and outdoor classrooms, rainwater catchment basins or tanks, waterless urinals and low-flow fixtures, composting toilets, bioswales, use of natural and mineral based cleaning products, water bottle refill stations, planting trees for shade areas and water uptake, edible gardens, cluster housing, more sustainably designed LEED certified buildings, etc.
Conclusion
Q: Give your community watershed a grade. How would you rank it on a scale of A to F (where A is very healthy because of the use of conservation practices, and F is very unhealthy)? Explain your reasons for the grade.
A: Grading of the community watershed will vary. Students should justify the grade they assign by identifying conservation practices that are in place in their watershed and examples of watershed neighbors that increase infiltration and decrease runoff.
Concluding Career STEM Question
Urban Planner
Q: New uses of land for housing, business, and farms are designed and built by urban planners, engineers, and landscape architects. If you were an urban planner why would it be important to promote green buildings and conservation practices?
A: Green buildings and conservation practices minimize the negative impact of development on water quality and quantity. They help promote infiltration and minimize runoff and can help ‘clean’ the water of pollutants before it goes into streams or drinking water supplies. Green buildings and conservation practices are sustainable practices that are good for the environmental and can save money for energy and stormwater management in the long-run
Further Investigation
This extension activity is proposed as an at home activity. Students can take pictures of their home, yard, neighborhood and upload them to this ITSI activity. Students can write captions to the photos will describing the impact their home property has on the health of the watershed and features in their neighborhood that improve or hurt the health of the watershed.
ACTIVITY 3 - TRACKING WATER IN MY SCHOOLYARD
Being Prepared
Students will go outside today to investigate their schoolyard. The teacher will give a quick tour of the schoolyard pointing out conservation practices that are already in place (e.g. rain garden, porous pavers, vegetative infiltration basin). Each student group will update their 1 Km schoolyard map marking and labelling areas where conservation practices are in place and areas where conservation practices are needed. Student groups will choose 1 study site in a conservation practice area and a second study site in an area where they feel a conservation practice is needed.
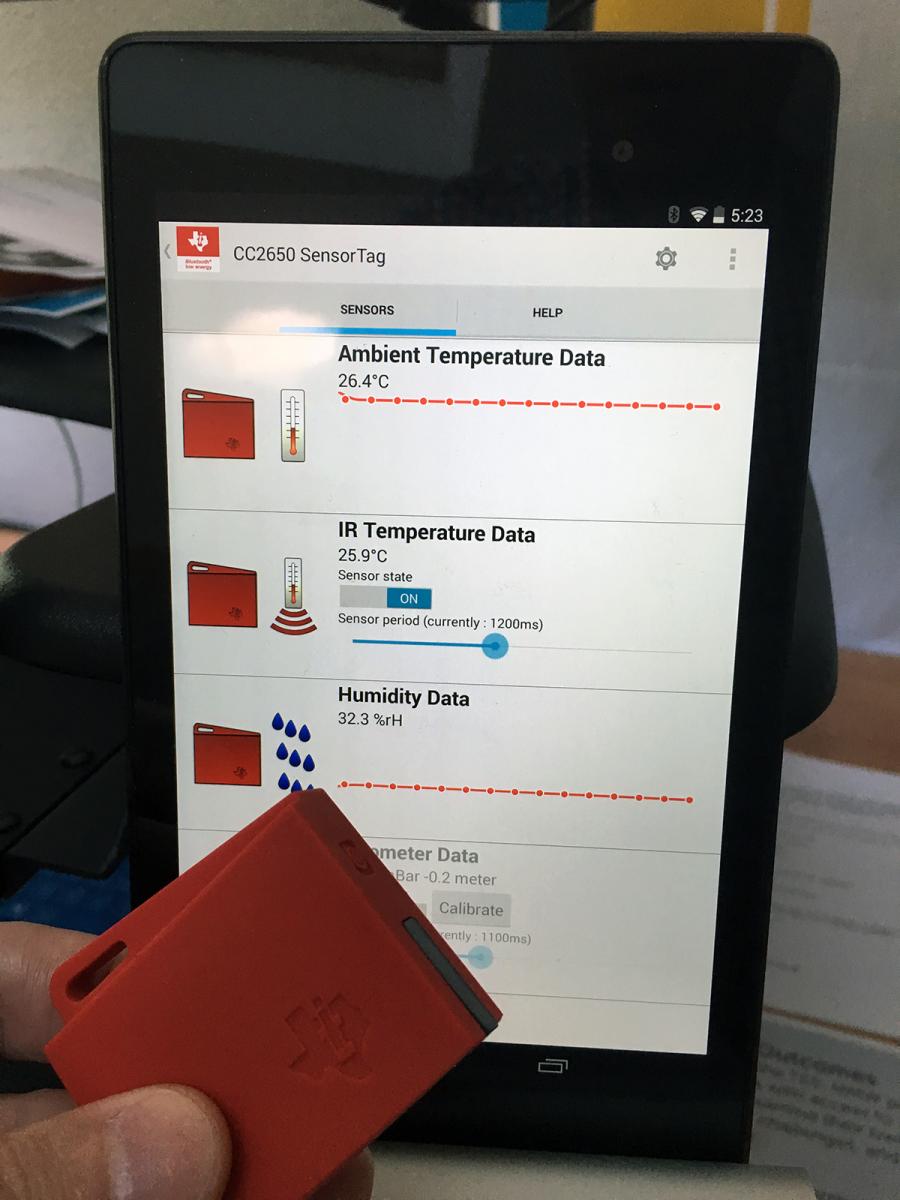
Students will make observations of their study sites and use a digital probe that displays data on a mobile device with the Water Tracker app. Teachers should become familiar with the use of the probe and app ahead of time.
Sensor Tag or Watershed Tracker
A new digital probe the Sensor Tag will be distributed to teachers starting in the 2016-2017 school year. For teachers that were involved in the program the previous year you can still use your Watershed Tracker digital probes. Note that soil moisture is no longer included in the curriculum and does not need to be recorded.
The Sensor Tags and Watershed Trackers are sensitive pieces of equipment, so students should be instructed on their proper handling and care prior to their use in order to prevent damage.
Students will need to have access to a mobile device that accepts Bluetooth signals. The new SensorTags are compatible with iPads (iPad 3 or newer) and iPhones (iPhone 4s and newer) running on iOS 8 or newer. They are also compatible with many Android phones and tablets.
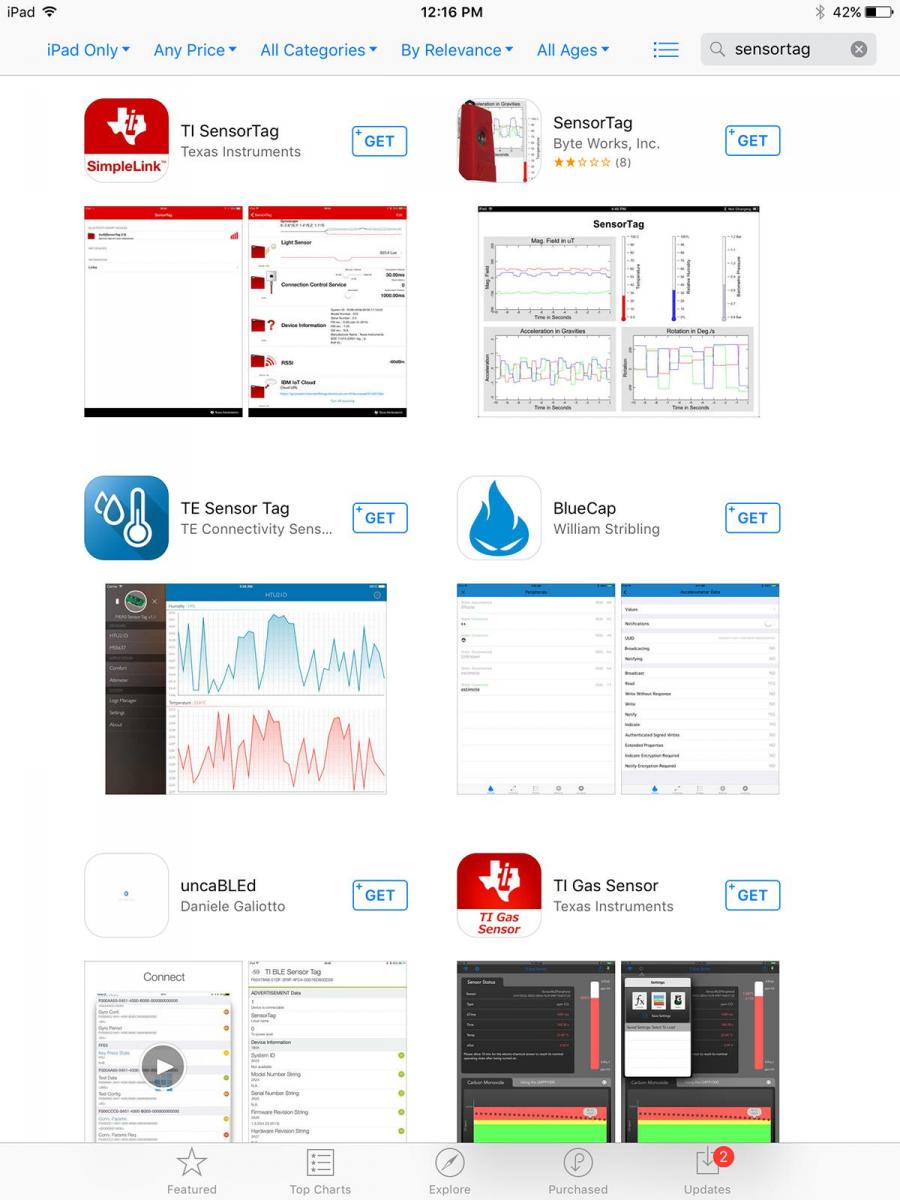
These devices will have to have the SensorTag app loaded on to them prior to pairing them with the SensorTags. This app may be downloaded for free from the Google Play store (for Android devices) and the App Store (for iOS devices). Check ahead of time to see how many students have devices that will run the SensorTag app. Also, follow any procedures outlined by your school to notify parents that an app will need to be loaded on their son or daughter’s personal device. Tables 2 and 3 (below) contain pictures and descriptions to help you find and download the app to your mobile device.
Table 2: Finding the app on Android devices.
 |
 |
 |
|
Search for "SensorTag" in the Google Play store. If you are unable to find it, search for "Texas Instruments" and it should come up as one of the options (see above -- the SensorTag app is listed top left). |
Above is a close up view of what the SensorTag listing looks like in the Google Play store. | Above is a view of the Google Play page that provides information on the SensorTag app and prompts you to install it on your mobile device. |
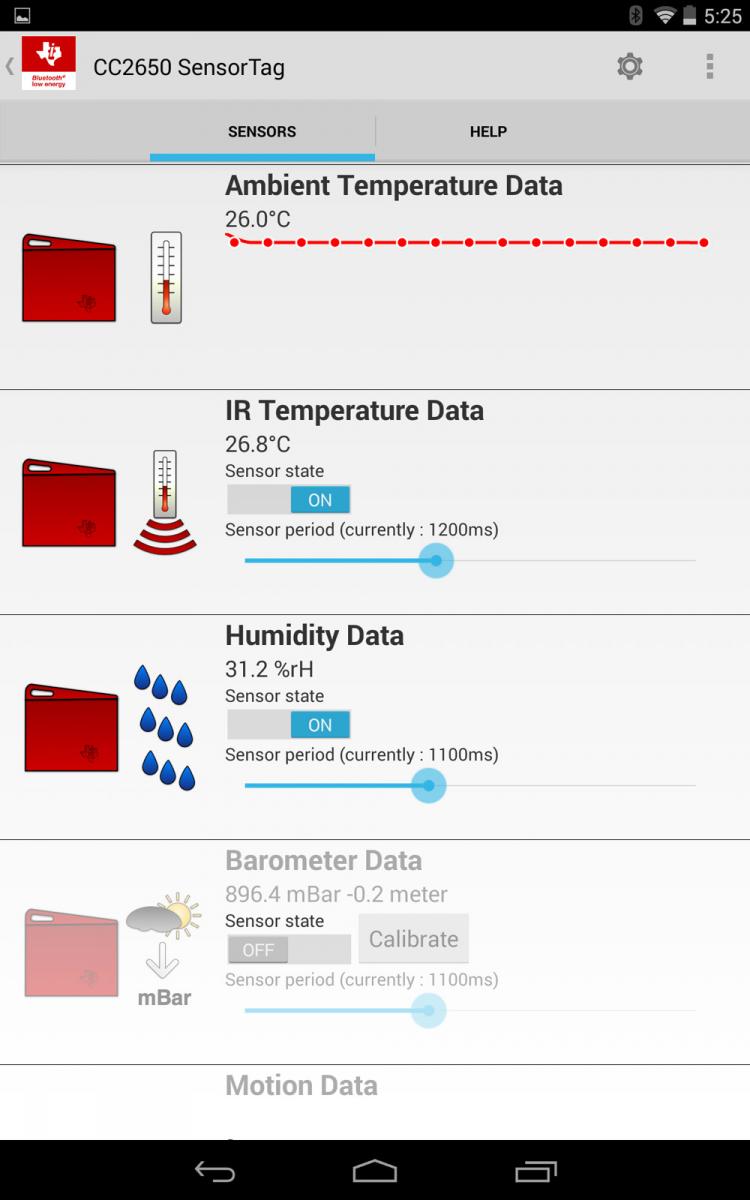
Table 4: Android SensorTag app display
 |
 |
|
Once the app detects a SensorTag is nearby, it will display a line of text listing its identification number. Tap on this number to open up the window that displays the data it is recording. To remove unneeded sensor listings:
Please note: The IR temperature sensor listing needs to be on for the ambient temperature sensor listing to work. |
Close up view of the Android SensorTag data display (above). As you can see, the app displays humidity, temperature, and light data. Note: Ambient Temperature and IR Temperature are linked and must remain viewable to see temperature data. Ambient Temperature is the surrounding air temperature and is the only number to record in the activity data tables. |
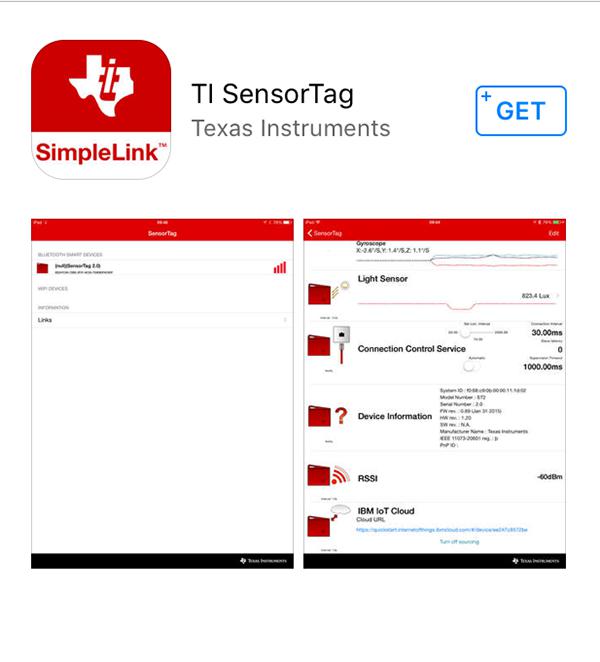
Table 2: Finding the app on iOS devices
 |
 |
 |
|
Search for "SensorTag" in the App Store. If you are unable to find it, search for "Texas Instruments" and it should come up as one of the options (see above -- the SensorTag app is listed top left). |
Above is a close up view of what the SensorTag listing looks like in the App Store. | Above is a view of the App Store page that provides information on the SensorTag app and prompts you to install it on your mobile device. |
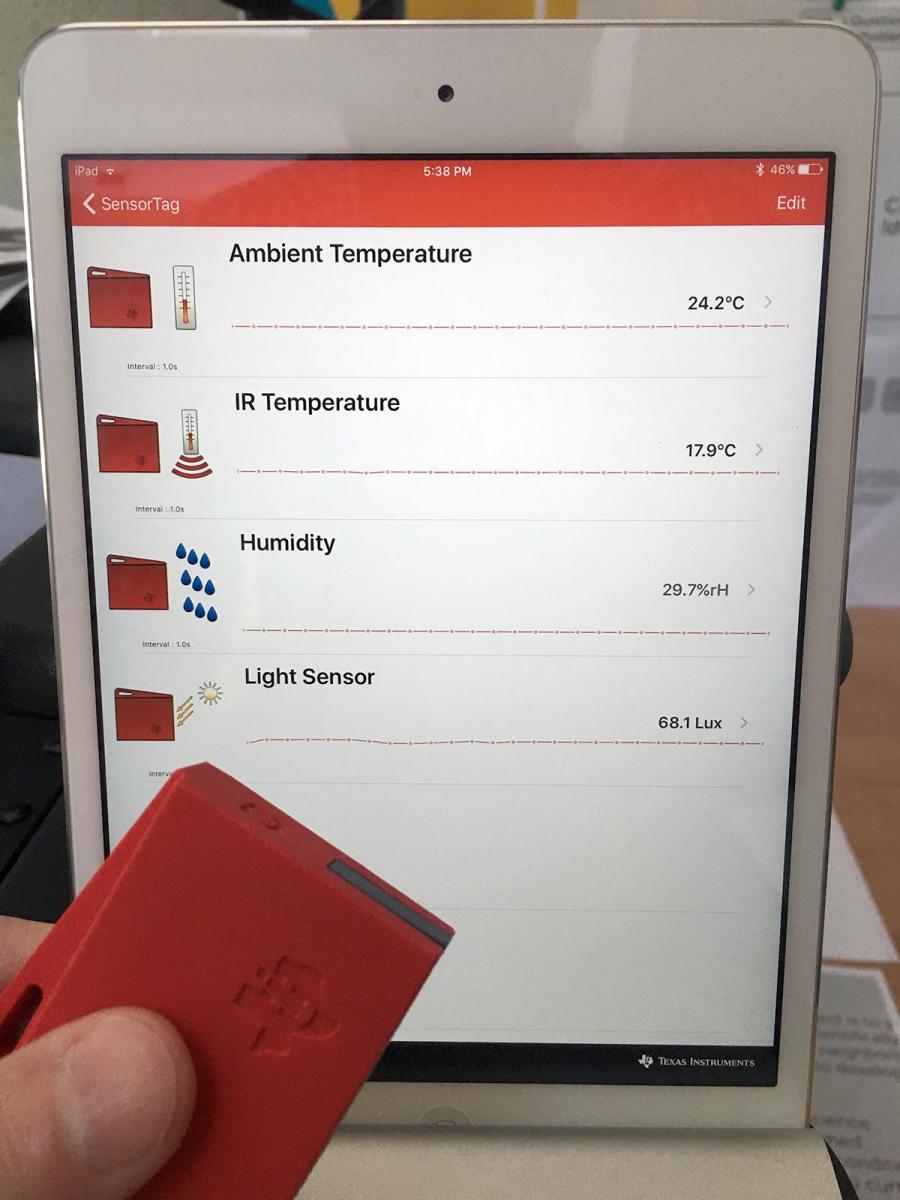
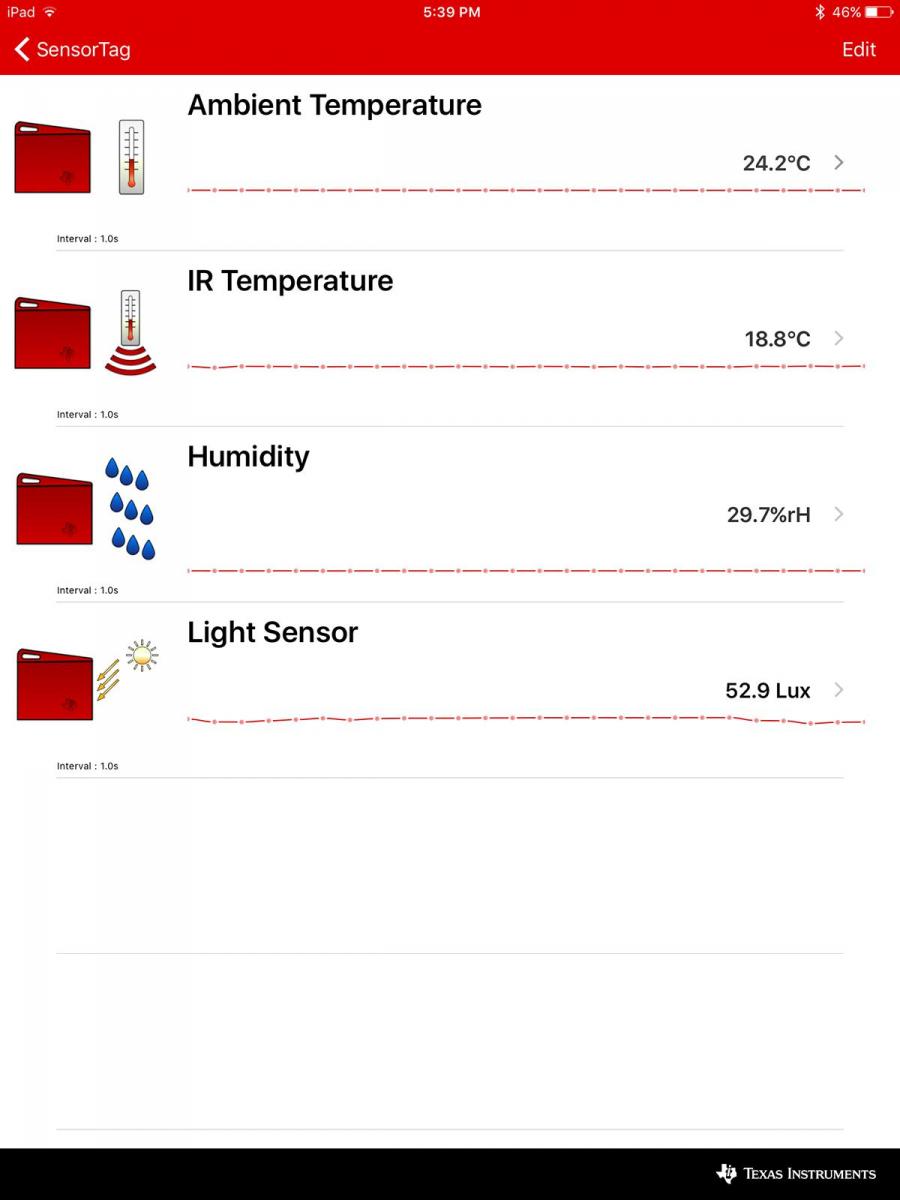
Table 4: iOS SensorTag app display
 |
 |
|
Once the app detects a SensorTag is nearby, it will display a line of text listing its identification number. Tap on this number to open up the window that will display the data it is recording. To remove unneeded sensor listings:
Please note: The IR temperature sensor listing needs to remain for the ambient temperature sensor listing to work. |
Close up view of the iOS SensorTag data display (above). As you can see, the app displays humidity, temperature, and light data. Note: Ambient Temperature and IR Temperature are linked and must remain viewable to see temperature data. Ambient Temperature is the surrounding air temperature and is the only number to record in the activity data tables. |
Using the Watershed Tracker probe in the field:
- To get the most accurate relative humidity and light readings with the SensorTag, it should be held 1.0 meter above the ground. The probe can be hung from a meter stick when making these readings.
Background
The digital SensorTag probe and app introduces three new data parameters. Relative humidity affects the rate of evapotranspiration. Plants grow best in certain temperature ranges and light promotes plant growth by affecting rates of photosynthesis. Vegetation on the land and type of soil in turn greatly reduces the amount of runoff and increases infiltration and storage of water during precipitation events.
Conservation practices are developed by landscape architects and civil engineers. They are designed to reduce both the amount of runoff and to improve the local water quality. In many municipalities, the increase in impervious surfaces can cause severe flooding problems. In some areas, stream banks can be deeply incised and sewers that are installed in stream banks can be exposed and break. The additional runoff can also cause flooding. In Valley Forge National Historic Park, George Washington’s Headquarters is on the banks of Valley Creek. Because of uncontrolled development in the headwaters of the creek, Washington’s Headquarters is threatened by even moderate storms and park rangers have to put sandbags around the structure to protect it. If conservation practices were implemented in headwater communities, Washington’s Headquarters could be protected.
Safety
Be careful not to disturb any wildlife or plants while investigating your study sites. If you are near or entering a wooded area, dress appropriately and be cautious of poison ivy and/or ticks.
Suggested Timeline
The activity is designed to be completed in a 50 minute period.
Learning Objectives
Essential Question: How do land features and conservation practices affect the flow of water in my schoolyard?
Learning Objectives:
- Students will identify conservation practices that are best suited for various places in their schoolyard.
- Students will compare observation data from different test sites in their schoolyard to determine how land features impact their local watershed.
- Students will collect light, temperature, and relative humidity readings from test sites in their schoolyard to characterize land cover and features.
Materials
Materials per student group:
- 1 square Km map of schoolyard used in previous lesson
- 1 meter stick
- Small wooden or plastic stakes (or other material to mark data collection points)
- String, fishing line, or tape to attached the Sensor Tag probe to one end of the meter stick
- Sensor Tag digital probe (or Watershed Tracker probe from prior year)
- EDIT Mobile device with “Water Tracker” app: Android that has BLE (Bluetooth Low Energy, Bluetooth 4.0 or Bluetooth Smart) or an iPad or iPhone
Introduction
Students are asked to think about and find areas in their schoolyard where there is a lot of runoff or erosion and conservation practices that promote infiltration. They will select 2 study sites, one that is in a conservation practice area where infiltration is promoted. The second study site should be an area where a conservation practice is needed, where there is a lot of runoff or impervious surfaces.
Q1: Are there areas in your schoolyard where there is a lot of runoff or erosion?
A: Answers will vary but students should list area of their schoolyard where they notice water flowing during storm events, soil that has been washed away. For example these locations frequently occur at the edge of a parking lot, lowest elevation, where the water runs to during a rain storm.
Collect Data I
Students will take a quick tour of their schoolyard with their teacher. During the tour students can update their 1 square Km schoolyard maps. They will also choose their 2 study sites and label them SS1 for Study Site #1 in a conservation practice area and SS2 for Study Site #2 in an area where a conservation practice is needed.
Optional data collection: Students may take pictures of different features and their schoolyard and later upload them to ITSI with comments explaining the pictures.
Collect Data II
After choosing their two study sites students will make visual observations of six features at each site and place this data in data tables.
- Conservation practice in place or suggested conservation practice
- Land cover type - grass, prairie, pavement, forest, shrubs, cropland, wetland, other
- Shade - shaded, partial shade, or no shade
- Slope of the land - steep hill, gentle hill, or flat land
- Surface water - dry, moist topsoil, standing water (puddles)
- Soil type
- Sandy - sand or gravel particles, porous, water flows through quickly
- Loam - mixture of particles sizes, similar to potting soil
- Sandy clay loam - like potting soil but with more clay, more compacted, slow infiltration rates
- Clay - very small compacted particles, does not allow water to infiltrate (not porous)
- No soil - pavement or other hard surface
Data Table 2: Observation data for Study Site #1 (SS1) located in a "CP" area:
| Conservation Practice | |
| Land Cover | |
| Shade | |
| Slope | |
| Surface Water | |
| Soil Type |
Data Table 3: Observation data for Study Site #2 (SS2) located in a "CPN" area:
| Conservation Practice | |
| Land Cover | |
| Shade | |
| Slope | |
| Surface Water | |
| Soil Type |
Collect Data III
Last students will use the Sensor Tag digital probe and app to collect relative humidity, temperature, and light data.
Procedures
- Locate the four corners and center of your two study sites. Mark the corners and center of each 1 square meter study site with a small stake or other marker.
- Hang or tape the Sensor Tag probe on your meter stick at 1 meter above the ground.
- Collect data by placing the Sensor Tag at the first data collection point (a corner of one of your study sites).
- Read the data on the app for temperature, humidity, and light for your sites. For accuracy, ambient temperature should be recorded in the shade, use your body to shade the digital Sensor Tag.
- Repeat this procedure to collect data at all four corners and the center of each study site.
- Calculate an average rating from 5 valid readings in each study site.
- Copy the data into Data Table 4 below. Observe the data in the bar graphs. Take a snapshot of your data table and bar graph.
Sample Data Table 4: Watershed Tracker Data![]()
Analysis
Q1: Did you identify and mark additional locations on your map where conservation practices are in place or are needed? Describe how you updated your schoolyard map.
A: Answers will vary. Students may learn about and mark additional watershed features on their maps during the tour of their schoolyard. One additional all students will mark on their maps is a location where they feel a conservation practice may be needed (CPN).
Q2: How are evapotranspiration, runoff, and infiltration impacted by the land features at your two study sites? (Hint: Use observation data as evidence in your answer.)
A: Students should describe study sites that are porous as ones that have high infiltration rates, sites that are impervious having high runoff rates, and sites with lots of vegetation as having high infiltration and evapotranspiration rates.
Q3: Are the 3 SensorTag data parameters (temperature, relative humidity, and light) independent or are there relationships between the data? Identify and explain any relationships between the data.
A: Students should notice that in most cases as light is high so is temperature. Relative humidity will be low if light and temperature are high unless it has recently rained. Relative humidity is also generally higher in shaded areas compared to open areas.
Conclusion
Q: For the site that you chose as "needing a conservation practice", what conservation practice do you think should be implemented at the site? How will it affect the flow of water in your schoolyard?
A: Students may propose that a green roof, rain garden, porous paving, or other conservation practice be added to their schoolyard. These conservation practices will increase infiltration and reduce runoff, minimizing pollution and flash flooding in the local watershed.
Concluding Career STEM Question
Environmental Engineer
Q: Do you know of any local areas around your school that an environmental engineer might help improve? If so, please describe the need.
A: Answers will vary based on location. An example answer would be identification of flood area or part of a stream that frequently overflows its banks. An environmental engineer may design infiltration basins to slow or catch some of the water in storm events.
Further Investigation
This extension activity is intended as a take home activity that builds on the take home extension activity from day 2. Students will look around their home and neighborhood and take pictures or make a sketch of existing conservation practices and areas where conservation practices are needed.
ACTIVITY 4 - EFFECTS OF LAND COVER & SOILS IN MANAGING WATERSHEDS
Being Prepared
The investigation focuses on using the Micro Site Storm Model in the ITSI portal. Teachers should familiarize themselves with the model before students begin the activity by reading the walkthrough user guide for the Micro Site Storm Model.
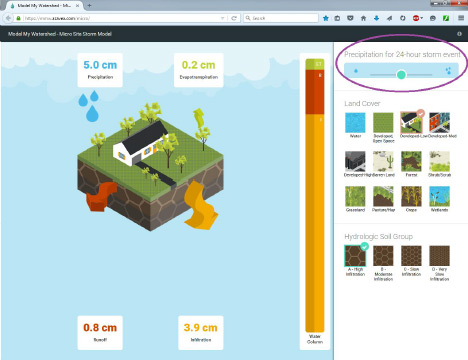
Image 1: Micro Site Storm Model components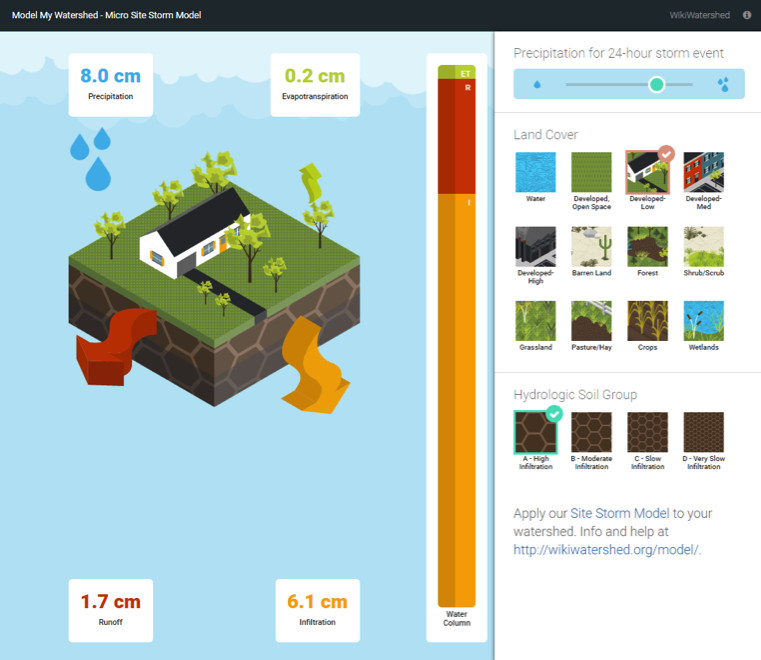
- Orient the students to the various components of the app (see Image 1 above as well as descriptions below that reference this table).
- On the left side of the screen students will see a 3-D visual depiction of a particular land cover type. Framing this picture will be four rectangles each containing data on the amount of precipitation, evapotranspiration, runoff, and infiltration one would expect for a single storm event.
- The middle of the app has a water column that will give students a visual representation of the evapotranspiration, runoff and infiltration amounts displayed for each land cover.
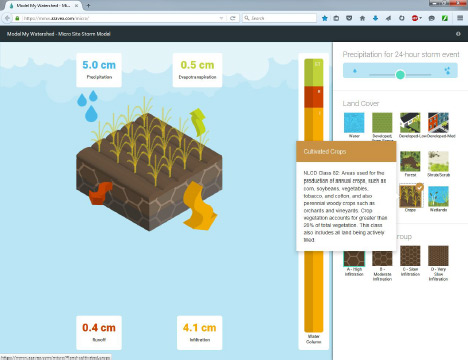
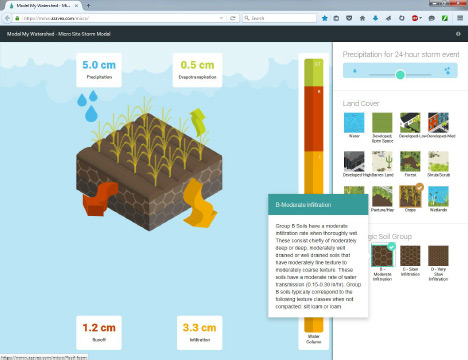
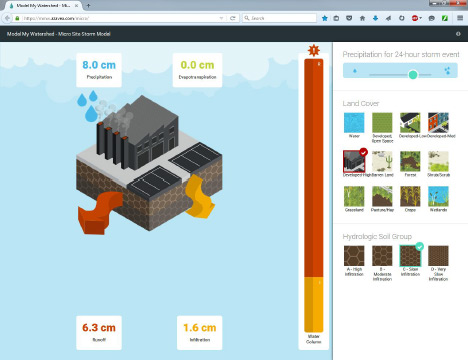
- Along the right side of the app are sections where students are able to choose from variables to test their effect on the movement of water on the micro site. At the top is a bar that allows the students to regulate the amount of precipitation. Below this bar is a section that allows students to pick different land cover types followed by a section where students can choose different soil types to test.
- Hovering over each individual land cover type and hydrologic soil group will open up a box giving a description of that variable.
Background
It may be important to explicitly mentioned to students that the micro site model is a hypothetical model of a single parcel of land. When changes are made to the land cover or soil type that change is applied to the entire model. In real life land cover, soil, and conservation practice changes are typically only applied to a portion of the land. The micro site model is a model that performs calculations based on accepted scientific data of evapotranspiration, runoff, and infiltration rates for land cover and soil types for single storm events, not rainfall over longer periods of time such as a year.
Safety
None
Suggested Timeline
The activity is designed to be completed in a 50 minute period.
Learning Objectives
Essential Question: What can you do to improve water in the lakes, rivers, and streams in your watershed?
Learning Objectives:
- Students will identify how land cover, rainfall totals and soil texture determine the path water travels.
- Students will explain the impact of land cover and soil texture on the health of the watershed.
Materials
Access to a computer and the ITSI online activity Part IV.
Introduction
The activity begins with a short reading about the importance of clean water and a diagram that reinforces watershed concepts. The major concepts to focus on in this activity are infiltration and runoff amounts as a result of land cover and soil type.
Collect Data I
In this part of the activity students become familiar with the Micro Site Storm Model. They can explore the different features to see how the amounts of evapotranspiration, runoff, and infiltration change when precipitation, land cover, and hydrologic soil group are changed.
Q: In the Micro Site Storm Model, the column in the middle has the labels ET (green in the bar graph), R (red in the bar graph), and I (yellow in the bar graph). What do these labels stand for?
A: ET stand for evapotranspiration, R stands for runoff, and I stands for infiltration.
Collect Data II
In this part of the activity students investigate how each land cover type affects where the water goes when it rains.
Procedures:
- Notice that the model displays three sections along the right-hand side, representing three different variables (precipitation at the top, land cover type in the middle, and soil type at the bottom). Make sure the precipitation bar is set to 8.0 cm of rain and the hydrologic soil group is set to loam (B-Moderate Infiltration).
- Hover over each of the land cover choices to read brief descriptions.
- Click on the Developed – High (Intensity) icon as a land cover and see what happens to the amount of evapotranspiration, runoff and infiltration. Record this data in the table below.
- Continue clicking on each of the other land cover types and record the amounts of evapotranspiration, runoff and infiltration for each in the data table.
- Once you have completely filled in your data table, a graph will be created to visually represent your data. Analyze the bars created for evapotranspiration, runoff and infiltration for each of the different land covers to compare the land covers.
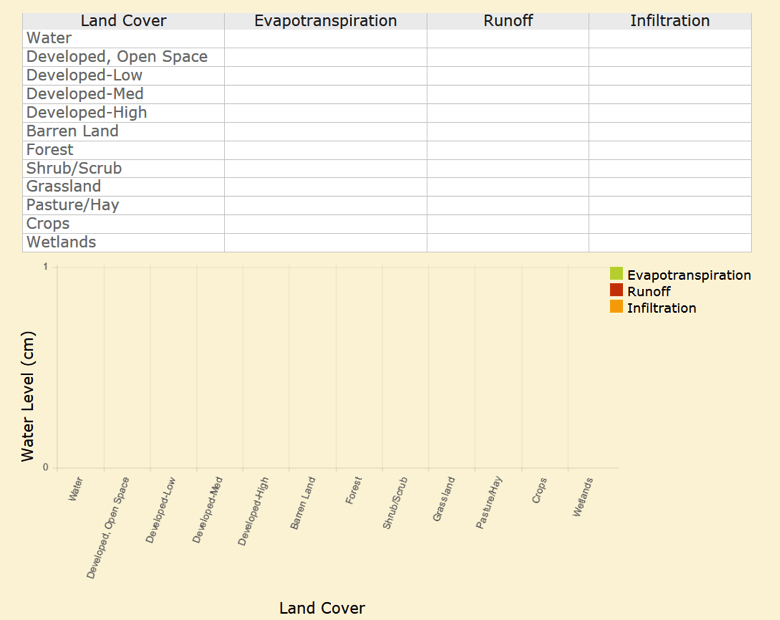
Q: Which type(s) of land cover produces the most amount of runoff? Why?
A: The land cover types that produce the most runoff are Developed-High Intensity (5.8 cm), Barren Land (4.6 cm), Developed-Medium Density (4.4 cm), and Crops (3.1 cm). These land cover types include impervious surfaces or hard packed soils.
Collect Data III
In this last part of the activity students investigate how the soil type affects the runoff and infiltration rates when it rains on a land cover area similar to their schoolyard.
Procedures:
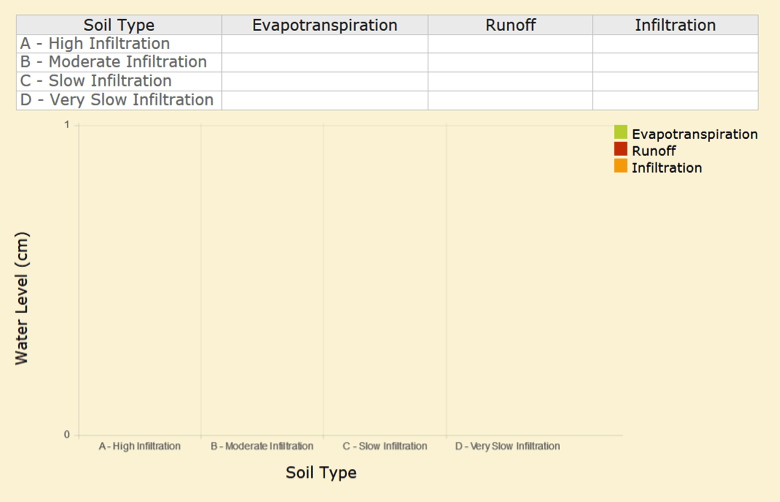
- Set the Micro Site Storm model to a land cover that best describes your schoolyard. Check to make sure the precipitation bar is set to 8 cm. of precipitation and the soil type is set to A-High Infiltration (sand). Stay with the same land cover to collect and record the amount of evapotranspiration, runoff and infiltration that occurs.
- Select each of the other soil types and record the corresponding numbers for evapotranspiration, runoff and infiltration in the data table.
Q: Which land cover type did you select that best represents your schoolyard?
A: Answer will vary based on your local schoolyard.
Q: Rank the soil types in order from the most runoff to least runoff. Compare the data in the table and graph. Which soil type produces the lowest amount of runoff?
A: Soil type A - high infiltration (sand)
Analysis
Q1: After using the Micro Site Storm Model, what do you predict that the Evapotranspiration, Runoff, and Infiltration amounts would be for your schoolyard from an 8.0 cm rain event?
A: Students should select the land cover type and soil group that best represent their schoolyard then run the microsite model to predict the amounts of evapotranspiration, runoff, and infiltration. For example, if they select Developed-Medium Intensity land cover and C-Slow Infiltration soil group their evapotranspiration would be 0.1 cm, runoff would be 5.4 cm, and infiltration would be 2.5 cm.
Q2: Explain how different soil and land cover types change the infiltration rate.
A: Soils with large particles like sand have higher infiltration rates. Soils with small particles like clay have high runoff rates. Land cover types with porous surfaces have high infiltration rates. Land cover types with impervious surfaces have high runoff rates.
Q3: If you were a city planner, what type(s) of land cover would you recommend to decrease the amount of runoff and increase the amount of infiltration?
A: Developed-Low Intensity housing areas because they have the lowest amounts of runoff compared to Developed-Medium and -High Intensity areas. City planners can also recommend some forest, wetlands, developed-open space areas because they lead to low amounts of runoff.
Conclusion
Q: What can your community do to improve the water (from runoff and infiltration) that fills your lakes, rivers, and streams in your watershed?
A: Infiltration is the key to improving the water quality in your watershed. Water that is filtered through the soil holds sediment and much of the pollution that would otherwise go into streams. Students should propose that their community include more land cover types that have high infiltration and low runoff rates.
Concluding Career STEM Question
Hydrologist
Q: How do you think modeling software and geographical information systems (GIS) have changed the role of a hydrologist in the recent years?
A: Modeling and GIS software help hydrologists analyze information about streamflow in the past and present and make predictions about streamflow in the future. These software also help hydrologists study possible scenarios of how land use changes will affect streamflow and water quality.
Further Investigation
In this extension activity students can go back outside in their schoolyard, neighborhood, or around their town to take pictures of impervious and porous surfaces. They can then upload their pictures with comments to the ITSI portal. If they do not have a camera they can sketch impervious and porous surfaces. This extension activity could be used for reinforcement of concepts or as an assessment.
ACTIVITY 5 - MODIFYING IMPROVEMENTS TO MY SCHOOLYARD
Being Prepared
This activity features the use of the online Model My Watershed (MMW) tool. Teachers should familiarize themselves with MMW before students begin the activity. MMW can be accessed through the ITSI activities. View the walkthrough user guide for MMW.
Background
MMW includes real data from national databases for land cover, soil type, stream networks, and more. This powerful online GIS tool is used by teachers, students, land use planners, conservation planners, scientists, citizen science groups, and the public. In this culminating activity students will create scenarios to modify the actual conditions in their location. Based on scenarios that students create MMW will provide land cover, soil, runoff, and water quality data for analysis.
Safety
None
Suggested Timeline
The activity is designed to be completed in a 50 minute period.
Learning Objectives
Essential Question: How can I improve my community watershed... starting with my own schoolyard?
Learning Objectives:
- Students will model possible changes in land cover on their watershed and describe the impact of these changes.
- Students will model possible changes in conservation practices on their watershed and describe the impact of these changes.
- Students will design a watershed plan for their schoolyard that maximizes the health of the watershed by implementing conservation practices and land cover changes.
Materials
Access to a computer and the ITSI online activity Part V.
Introduction
Students are prompted with the challenge to reduce runoff as much as possible from their schoolyard. They should refer back to their 1 Km schoolyard maps from earlier activities and begin to think about which conservation practices could be applied and where they could be located. At the same time they should consider all of the current activities that take place on and around their schoolyard and think about how conservation practices could be applied while still using the land for the same activities.
Q: Make a prediction of areas in your school yard where conservation practices would improve infiltration amounts of water.
A: Answer for teachers guide: Answers will vary based on location but will likely include identification of areas that are impervious such as parking lots, sidewalks, roofs.
Collect Data I
Run MMW for the 1 square Km around your schoolyard.
Procedures:
- In the search field type in the address of your school.
- In the "Layers" control box "Basemap" tab select “Satellite with Roads.”
- Select "Get Started" to create a 1 square Km map around your school.
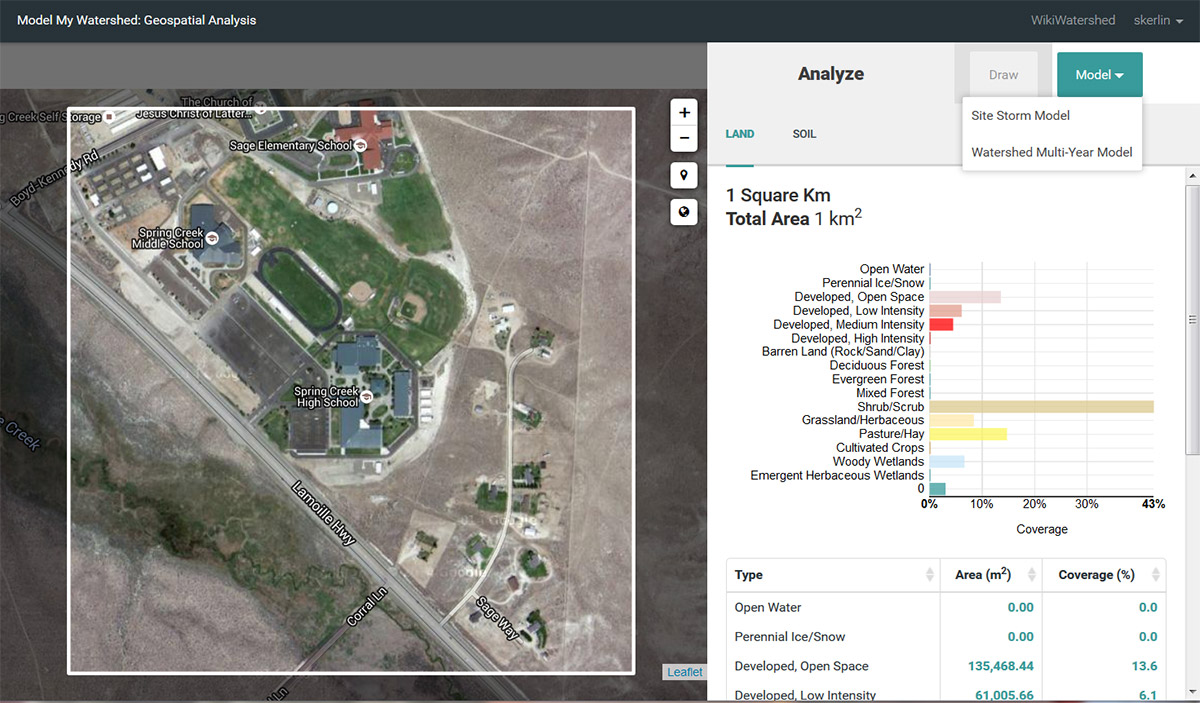
- In the “Draw Area” menu select “Square Km”. Place the marker on your school to select the area. A square kilometer map of your school site will now appear along with data you can analyze. In this analyze section, you can view land, soil, and other data about your site.
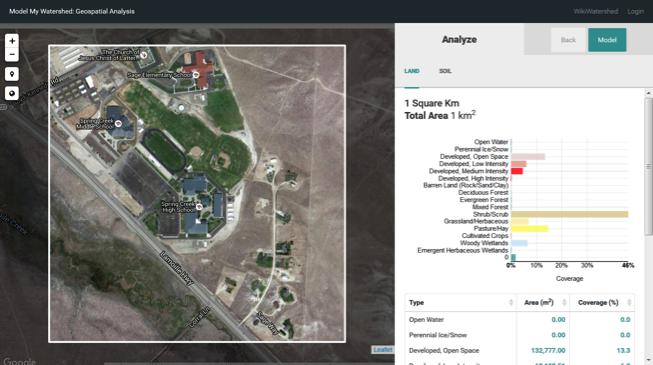
Example School Site Spring Creek High School, NV
Image 1: Land and Soil Data
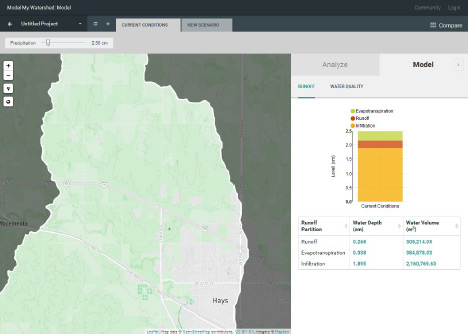
- In the teal "Select a model" button, select "Site Storm Model" to view the data for current conditions for Runoff and Water Quality.
Image 2: Current Conditions
- The precipitation slider near the top middle of the map is set by default to 2.50 cm. You can change the precipitation to a 24-hour storm size of your choice. If you do change it, make sure it is set at the same amount for the remainder of the activity.
- Now change the land cover type to 100% forest and 100% developed-Med (e.g. homes and businesses), recording the outcomes in the chart each time. To create these new scenarios first click on "Add changes to this area" near the top right of the map. You will then see teal buttons near the top center of the map to change the land cover or add conservation practices to your 1 square Km site. Select "Land cover" to view and choose land cover changes to model. Then click the four corners of your 1 square Km map. The model will update with new runoff and water quality data on the right side. To run additional scenarios click the "+ New scenario" button near the top left.
Image 3: 100% Forest Cover Scenario
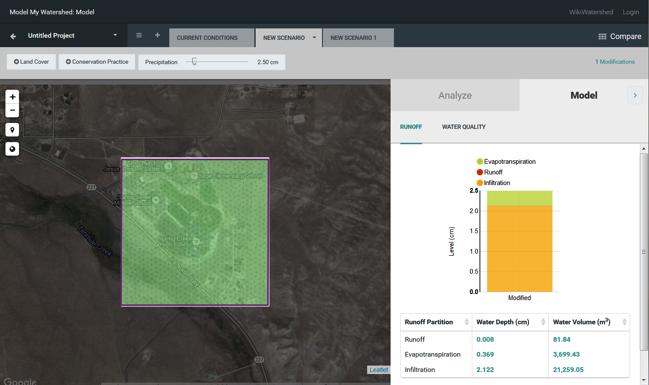
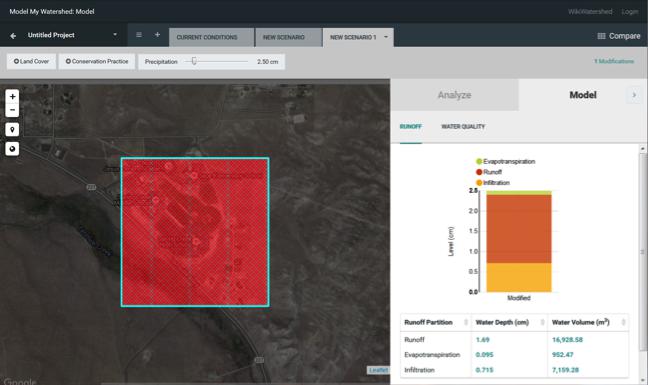
Image 4: 100% Developed-Medium

Students input their evapotranspiration, runoff, and infiltration data into the data table and graph for the current conditions, 100% forest cover, and 100% developed-medium scenarios.
Q: Compare the evapotranspiration, runoff, and infiltration graphs of the current condition, forest and developed-medium land covers. Did one type of modeled land cover show better results with less runoff?
A: The 100% forest cover will show the best results with the least amount of runoff.
Collect Data II
Students will next create scenarios to model two different conservation practices of their choice for their location.
Image 5: Example of cluster housing conservation practice scenario added to current conditions.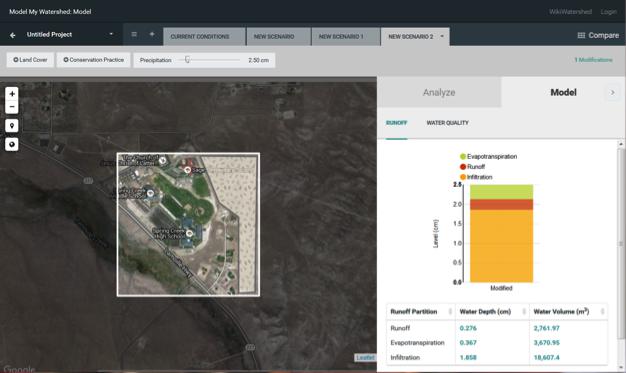
Image 6: Example of rain garden conservation practice scenario added to current conditions.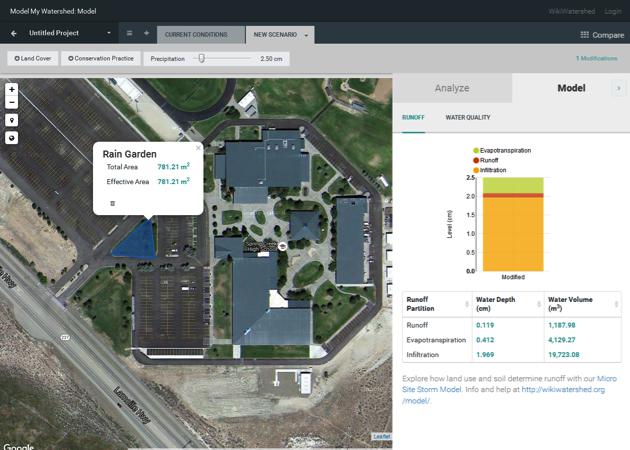
Students input their evapotranspiration, runoff, and infiltration data into the data table and graph for the two conservation practices and compare the data to the current conditions, 100% forest cover, and 100% developed-medium scenarios.
Analysis
Q1: Which conservation practices did you choose? Why did you select those types for your site?
A: Students will choose from the 6 conservation practices - rain garden, vegetative infiltration basin, porous paving, green roof, no-till agriculture, or cluster housing. They should choose conservation practices that fit on their site and still allow for all existing activities to take place.
Q2: Compare the graphs. What affect did the conservation practices have compared to converting the entire area to forest or medium intensity development?
A: Converting the entire area to 100% forest will have the largest effect of minimizing runoff. Conservation practices will help reduce some runoff. Medium intensity housing developments will increase the amount of runoff.
Q3: Once you applied certain conservation practices at your school, are there any compromises or additional features you might need to make to assure that important activities (e.g., parking, access to areas, sports fields, etc.) could still happen at your school?
A: Applying new conservation practices may change how the land on the school property is used. Some land for outdoor activities like sports may be converted to new conservation practices such as rain gardens. At the same time new education learning stations could be included at the sites of the new conservation practices.
Conclusion
Q: Which conservation practices are appropriate for areas on your school site? Which ones are appropriate for areas in your community? (Hint: Consider the size of the areas, type of conservation practice, costs to implement the practices, and citizen usage of the areas).
A: Green roofs, porous paving, rain gardens, and vegetated infiltration basins are appropriate for many school sites. These four conservation practices can be applied to smaller areas and can be used for education purposes. All of these plus no-till agriculture and cluster housing are appropriate for communities. No-till agriculture and cluster housing are used in larger areas and will have larger effects on runoff and infiltration amounts.
Concluding Career STEM Question
Urban Planner
Q: What are the goals of an urban planner? How can an urban planner protect or improve water quality and flow of water in your community.
A: Urban planners design towns and cities where people live, work, and play. They consider the impact of buildings, businesses, and people on the environment including water in streams and lakes. Urban planners can design towns and cities that include conservation practices to minimize runoff and pollution in streams and drinking water supplies. They can also plan and create natural areas near streams, rivers, and lakes as streamside buffers and recreation areas.
Further Investigation or Final Project for Unit Assessment
Design a watershed plan for your schoolyard that maximizes the health of the watershed by implementing conservation practices and land cover changes. Use Model My Watershed to experiment with different scenarios until you find the ones for your schoolyard that lead to the lowest amounts of runoff and greatest amounts of infiltration keeping in mind all of the current activities and uses of the land. Create and lead a presentation of your plan to your class, principal, school board, or parent-teacher organization.
Supplemental Activities
Supplemental Activity 1 - Enviroscape Models
Enviroscape models are popular resources in many classrooms. If you have an enviroscape model you can use it to introduce or further teach watershed concepts. www.enviroscapes.com
Now that you have explored your watershed and met your watershed neighbors, watch the following video to learn how the land that makes up a watershed is connected and how the actions of one member of a watershed impact all other members of the watershed.
After using the enviroscape describe three specific example of how the actions of one member of a watershed can impact other members of the watershed.
Supplemental Activity 2 - Demonstrating Runoff
Outside in your schoolyard, parking lot, or other areas use a ball and roll it from high ground to storm water drains to demonstrate a rain event and where water flows. Student observation of this simple activity helps them visualize "runoff" action. Focus their attention on the topography of the land. Water will always run from a higher elevation to a lower elevation.
Supplemental Activity 3 - MMW Scenario for Community Impact
Choose a one square kilometer area in the community watershed that you think has the most negative impact on the watershed. Using Model My Watershed, implement best conservation practices and land cover changes to maximize the watershed health of the area. Take a snapshot of your changes.
Why did you choose the community site to modify? Which modification had the greatest impact on the watershed health?
Water Scientist Videos
- William Anderson (download)
Bill is an environmental educator and retired High School AP Environmental Science teacher. - David Arscott (download)
Dave is the Stroud Water Research Center Executive Director and stream ecologist. - Laura Zgleszewski (download)
Laura is a microbial molecular scientist and fish ecologist. - David Bressler (download)
David trains citizen scientists and facilitates support for watershed organizations. - Melinda Daniels (download)
Melinda is a fluvial geomorphologist. - Charles Dow (download)
Charlie manages an information services group and does network administration and data management and analysis. - Michael Gentile (download)
Mike runs an analytic chemistry lab. - Libby Gregg (download)
Libby is a computer and network specialist and environmental educator. - Steve Kerlin (download)
Steve is an environmental educator and researcher, and the Director of Education at Stroud Water Research Center. - John Jackson (download)
John is a senior research scientist and entomologist. - Kelly McIntyre (download)
Kelly is an early career entomologist. - Dave Montgomery (download)
Dave manages the infrastructure in an 1,800 acre research watershed.
Unit Vocabulary
Ambient temperature – the current air temperature, the overall temperature of the outdoor air that surrounds us. For accuracy ambient temperature readings should always be taken in the shade.
Aquifer - An underground geological formation, or group of formations, containing usable amounts of groundwater that can supply wells or springs for domestic, industrial, and irrigation uses.
Cluster housing – When developers build a community, they can build the houses closer together and leave other areas open and undeveloped where they plant trees and other plants that will soak up the rain. This reduces flooding and lets water soak back into the ground.
Composting - The controlled biological decomposition of organic material, such as sewage sludge, animal manures, or crop residues, in the presence of air to form a humus-like material.
Conservation practice - Control measures consisting of managerial, vegetative, and structural practices to reduce the loss of soil and water. Also known as best management practices (BMPs).
Development (housing) - A group of individual dwellings or apartment houses typically of similar design that are usually built and sold or leased by one management.
Elevation – The distance above sea level.
Erosion - The wearing away of land surface by wind or water, intensified by land-clearing practices related to farming, residential or industrial development, road building, or logging.
Evaporation – The process of water changing from a liquid to a gas. That gas is water vapor, where the water molecules are suspended in the air. Warm air holds lots of water molecules, which is why it feels more humid in warm weather.
Evapotranspiration - The loss of water from the soil both by evaporation and by transpiration from the plants growing in the soil.
Flood - Any relatively high streamflow that overflows the natural or artificial banks of a stream.
Green roofs - Green roofs have plants growing on them. They keep the rain from running off the building and causing flooding and erosion. The plants soak up the rain and put it back into the atmosphere through evapotranspiration.
Groundwater - The water from wells and underground aquifers.
Hydric (hydrologic) soil - Soil in its undrained state is flooded long enough during a growing season to develop anaerobic conditions that support the growth and regeneration of hydrophytic vegetation (plants specialized to grow in water or in soil too waterlogged for most plants to survive).
Impervious - An area that cannot infiltrate water, but causes the water to run off to another area.
Infiltration – The process of water soaking into the ground.
Infrastructure - The basic physical and organizational structures and facilities (e.g., buildings, roads, and power supplies) needed for the operation of a society or organization.
Irrigation – Application of water or wastewater to land areas to supply the water and nutrient needs of plants.
Landfill - Sanitary landfills are disposal sites for non-hazardous solid wastes spread in layers, compacted to the smallest practical volume, and covered by material applied at the end of each operating day.
Nonpoint source pollution - Pollution from diffuse sources resulting from runoff, precipitation, atmospheric deposition, drainage, seepage or hydrologic modification. Runoff picks up and carries natural and human-made pollutants into lakes, rivers, wetlands, coastal waters, and groundwater.
No-till agriculture - The farmer plows fields and plants crops without removing the plants that are already there. Like the other CPs, it keeps the water from running off of the field and taking mud and chemicals into the streams and rivers. The water that soaks in makes it better for the crops to grow. It also keeps weeds out of the field.
Percolation - The movement of water downward through subsurface soil layers, usually continuing downward to ground water.
Pervious - capable of being permeated, penetrable, especially having pores or openings that permit liquids or gases to pass through.
Photosynthesis – The process that green plants use to make food from carbon dioxide it gets from the atmosphere and water it gets from the ground through its roots.
Point source pollution - Any single identifiable source of pollution from which pollutants are discharged, such as a pipe, ditch, ship or factory smokestack. Factories and sewage treatment plants are two common types of point sources.
Pollution – Chemicals, pathogens and other harmful things that could have bad effects on people and other living things.
Porous - An area that is capable of infiltrating (soaking up) water and putting it into the ground.
Porous paving - This is a way to have an area where cars can park but still let water soak into the ground. Below the surface blocks, they have gravel that lets the water soak in. Because of the gravel, there is room under the parking area for the water to stay until it soaks into the ground.
Rain garden - Rainwater that falls on the land drains into a specific place, a rain garden, where it soaks into the ground. It is usually small and is built in residential yards. It has plants that like wet soil and keeps the water from polluting streams and rivers, since soil helps to clean water. Without a rain garden, water runs off of the surface and it can carry mud and pollution into streams and rivers.
Rain water capture – Catching rain water in a barrel or cistern in order to reuse it for another purpose.
Rainwater retention basin (or bioswale) - A long, channeled depression or trench that receives rainwater runoff (as from a parking lot) and has vegetation (such as grasses, flowering herbs, and shrubs) and organic matter (such as mulch) to slow water infiltration and filter out pollutants.
Relative humidity - A ratio (expressed as a percentage) comparing the amount of water vapor contained in air of a certain temperature versus how much water vapor that same air would contain if it were completely saturated.
Relief - The elevations or inequalities of a land surface.
Runoff – Water that does not soak into the ground but runs across the surface of the land into streams, rivers, lakes or storm-water basins and sewers.
Sediment - Particles from rocks or biological materials that have been transported by, suspended in, or deposited by air, water, or ice or that are accumulated by other natural processes.
Sewage treatment plant – a municipal facility that cleans human waste water.
Slope – The angle of the land compared to the horizontal. Water runs from a higher to lower elevation, down the slope of a hill.
Soil moisture - The quantity of water contained in the soil.
Sustainability – Methods that using resources so they are not depleted or permanently damaged. Sustainably designed buildings conserve the use of resources such as water and energy.
Temperature - Measure of the amount of heat (kinetic energy) in a given area.
Topography - The physical features of the land (mountains, hills, valleys, etc.).
Transpiration - The process that plants do when they take up water to support photosynthesis then release water back into the atmosphere through evaporation.
Tributary – A small stream that feeds a larger stream or a lake.
Vegetated infiltration basin – This is like a rain garden but much bigger. It does the same thing, makes the water soak into the ground. They are built in large developments, such as schoolyards and shopping malls. The plants that live there like wet soil and help it soak into the ground.
Wastewater wetland – A constructed marsh or swamp area designed to treat sewage.
Water quality criteria - Levels of water quality expected to render a body of water suitable for its designated use. Criteria are based on specific levels of pollutants that would make the water harmful if used for drinking, swimming, farming, fish production, or industrial processes.
Watershed - All of the land where any rain that falls runs into the same stream, river or lake. It includes the hills, valleys, towns, farms and any other land, even rivers, lakes and wetlands where the water goes.
Wetlands – Low areas that water flows into and where the soil is almost always wet through most or all of the year. There may or may not be water visible at the surface.
Unit Alignment to Next Generation Science Standards (NGSS)
Activities in the 5-day watershed unit address parts of the following standards.
Middle School
Engineering, Technology, and Applications of Science: Engineering Design
Performance Expectations
- MS-ETS1-2 Define the criteria and constraints of a design problem with sufficient precision to ensure a successful solution, taking into account relevant scientific principles and potential impacts on people and the natural environment that may limit possible solutions.
- MS-ETS1-2 Evaluate competing design solutions using a systematic process to determine how well they meet the criteria and constraints of the problem.
- MS-ETS1-3 Analyze data from tests to determine similarities and differences among several design solutions to identify the best characteristics of each that can be combined into a new solution to better meet the criteria for success.
- MS-ETS1-4 Develop a model to generate data for iterative testing and modification of a proposed object, tool, or process such that an optimal design can be achieved.
Science and Engineering Practices
- Developing and Using Models
- Analyzing and Interpreting Data
- Engaging in Argument from Evidence
Disciplinary Core Ideas
- ETS1.B: Developing Possible Solutions
- ETS1.C: Optimizing the Design Solution
Crosscutting Concepts
- Influence of Science, Engineering, and Technology on Society and the Natural World
Earth & Space Sciences: Earth’s Systems
Performance Expectations
- MS-ESS2-4 Develop a model to describe the cycling of water through Earth’s systems driven by energy from the sun and the force of gravity.
Science and Engineering Practices
- Developing and Using Models
- Constructing Explanations and Designing Solutions
Disciplinary Core Ideas
- ESS2.A: Earth’s Materials and Systems
- ESS2.C: The Roles of Water in Earth’s Surface Processes
- ESS3.A: Natural Resources
Crosscutting Concepts
- Cause and Effect
- Energy and Matter
- Stability and Change
Earth & Space Sciences: Human Impacts
Performance Expectations
- MS-ESS3-2 Analyze and interpret data on natural hazards to forecast catastrophic events and inform the development of technologies to mitigate their effects.
- MS-ESS3-3 Apply scientific principles to design a method for monitoring and minimizing a human impact on the environment.
- MS-ESS3-4 Construct an argument supported by evidence for how increases in human population and per-capita consumption of natural resources impact Earth’s systems.
Science and Engineering Practices
- Analyzing and Interpreting Data
- Constructing Explanations and Designing Solutions
- Engaging in Argument from Evidence
Disciplinary Core Ideas
- ESS3.C: Human Impacts on Earth Systems
Crosscutting Concepts
- Patterns
- Cause and Effect
Connections to Engineering, Technology, and Applications of Science
- Influence of Science, Engineering, and Technology on Society and the Natural World (MS-ESS3-4, MS-ESS3-2, MS-ESS3-3)
Connections to Nature of Science
- Science Addresses Questions About the Natural and Material World (MS-ESS3-4)
High School
Engineering, Technology, and Applications of Science: Engineering Design
Performance Expectations
- HS-ETS1-3 Evaluate a solution to a complex real-world problem based on prioritized criteria and trade-offs, that account for a range of constraints, including cost, safety, reliability, and aesthetics as well as possible social, cultural, and environmental impacts.
- HS-ETS1-4 Use a computer simulation to model the impact of proposed solutions to a complex real-world problem with numerous criteria and constraints on interactions within and between systems relevant to the problem.
Science and Engineering Practices
- Using Mathematics and Computational Thinking
- Constructing Explanations and Designing Solutions
Disciplinary Core Ideas
- ETS1.A: Defining and Delimiting Engineering Problems
- ETS1.B: Developing Possible Solutions
Crosscutting Concepts
- System and System Models
Connections to Engineering, Technology, and Applications of Science
- Influence of Science, Engineering, and Technology on Society and the Natural World
Life Science: Interdependent Relationships in Ecosystems
Performance Expectations
- HS-LS2-7 Design, evaluate, and refine a solution for reducing the impacts of human activities on the environment and biodiversity.
Science and Engineering Practices
- Using Mathematics and Computational Thinking
- Constructing Explanations and Designing Solutions
- Engaging in Argument from Evidence
Disciplinary Core Ideas
- ETS1.B: Developing Possible Solutions
Crosscutting Concepts
- Cause and Effect
- Stability and Change
Earth and Space Science: Earth’s Systems
Performance Expectations
- HS-ESS2-2 Analyze geoscience data to make a claim that one change to Earth’s surface can create feedbacks that cause changes to other Earth systems.
- HS-ESS2-5 Plan and conduct an investigation of the properties of water and its effects on Earth materials and surface processes.
Science and Engineering Practices
- Developing and Using Models
- Planning and Carrying Out Investigations
- Analyzing and Interpreting Data
- Engaging in Argument from Evidence
- Connections to Nature of Science
- Scientific Knowledge is Based on Empirical Evidence
Disciplinary Core Ideas
- ESS2.A: Earth Materials and Systems
- ESS2.C: The Roles of Water in Earth’s Surface Processes
Crosscutting Concepts
- Structure and Function
- Stability and Change
Connections to Engineering, Technology, and Applications of Science
- Influence of Engineering, Technology, and Science on Society and the Natural World
Earth and Space Science: Human Sustainability
Performance Expectations
- HS-ESS3-1 Construct an explanation based on evidence for how the availability of natural resources, occurrence of natural hazards, and changes in climate have influenced human activity.
- HS-ESS3-4 Evaluate or refine a technological solution that reduces impacts of human activities on natural systems.
- HS-ESS3-6 Use a computational representation to illustrate the relationships among Earth systems and how those relationships are being modified due to human activity.
Science and Engineering Practices
- Using Mathematics and Computational Thinking
- Constructing Explanations and Designing Solutions
- Engaging in Argument from Evidence
Disciplinary Core Ideas
- ESS3.A: Natural Resources
- ESS3.B: Natural Hazards
- ESS3.C: Human Impacts on Earth Systems
- ETS1.B: Developing Possible Solutions
Crosscutting Concepts
- Cause and Effect
- Systems and System Models
- Stability and Change
Connections to Engineering, Technology, and Applications of Science
- Influence of Science, Engineering, and Technology on Society and the Natural World
Connections to Nature of Science
- Science Addresses Questions About the Natural and Material World