Teaching Environmental Sustainability: Model My Watershed Teacher Guide
Table of Contents
Unit
Watershed
Subject
Environmental Science
Grade Level
MS/HS
Prior to the start of your unit:
Being Prepared
Before beginning day 1 of this 7 day project, you will need to log on to the ITSI Portal and create a class.
- Once your class is selected, click the EDIT button to add activities to your class.
- The Model My Watershed Activities are located under the "High School Environmental Science" activity page.
- Select the appropriate modules you would like added to your class, by clicking the box next to each module.
- Once all modules are selected, click the "Save this class" button.
You must repeat these steps for each of your classes prior to students logging on.
- Once you save your class you can preview what your students will see when logging in, by clicking the "Preview" button.
It would be best to have students, create accounts and log in to explore the ITSI portal prior to beginning the Model My Watershed curriculum.
*When students create their account, they should record their username, that is generated for them by the ITSI portal, and password in a known location so they can access it easier. There is the ability to see the username of a student and to change a password if a student forgets.
If you need assistance, use the tutorials located in the Help section of the ITSI portal.
How to Use the Micro Site Storm Model
print this section
The M?odel My Watershed (MMW) Micro Site Storm Model ?animates results from applying the TR-55 r?unoff model developed by the US Department of Agriculture and the Small Storm Hydrology Model for Urban Areas developed by Robert Pitt for a single 24-hour rain storm over a hypothetical small unit of land with a single land cover class and a single hydrologic soil group. The complementary MMW S?ite ?Storm Model performs the same model calculations for a selected land area within the continental United States by using actual land cover and soil data for the selected land area.
The MMW Micro Site Storm Model is available online through the I?nnovative Technology in Science Inquiry (ITSI) portal or in any web browser at mmw.azavea.com/micro. When you run the full Model My Watershed Storm Model application, the exact same calculations are happening on every single pixel of the map and are being added together to calculate what is happening for a whole map area. Please note that although the look of the graphics of the model may have changed from the time this walkthrough was created, the placement and functionality of the controls will not change.
As a "micro" model, there are only a few controls to worry about. At the top right is a slider where you can adjust the level of rainfall within 24 hours from a small rainstorm (equivalent to 1 cm of rain) to a hurricane (21 cm of rain). As you adjust the slider from left to right the rainfall increases. The amount of rainfall is shown on the box on the upper left.
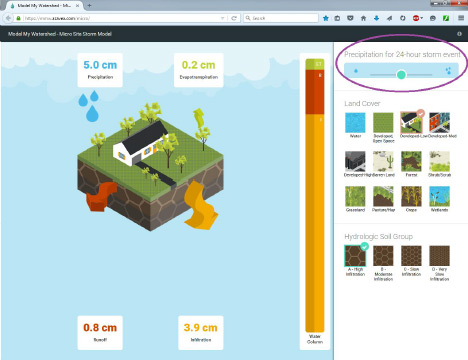
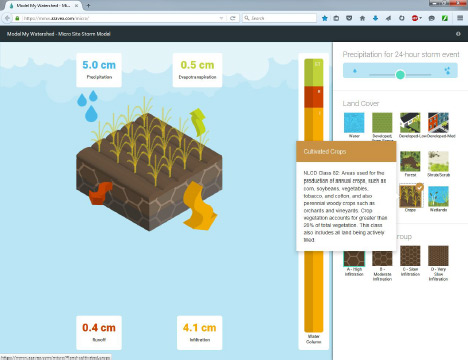
Below the rainfall, you can select the land cover type. These land cover types and the general color scheme are taken directly from the National Land Cover Database made by the U.S. Geological Survey. A help bubble describing each land cover type will appear as you hover over that land type.
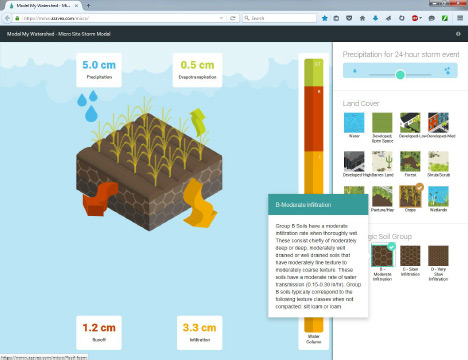
On the lower right, you can also select the hydrologic soil group. These four hydrologic soil group were defined by the U.S. Department of Agriculture in 1955. Soil scientists group all soils in the U.S. into one of these four groups based on how the soils absorb and transmit water. There are also help bubbles here describing the soil types.
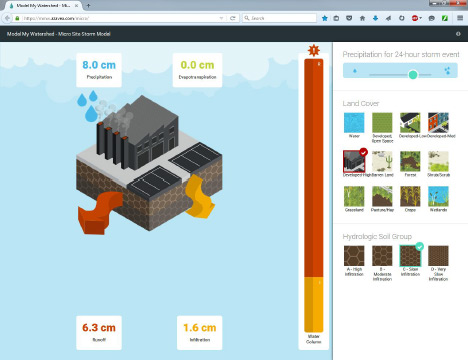
As the parameters are selected on the right part of the screen, the infographic on the left changes. It will always show a cube of land with the selected land cover on top and the soil type on the sides. In the upper left corner of the infographic is a box with the amount of rainfall listed. The other four corners of the infographic show the amount of rainfall that will end up as evapotranspiration (ET, water that immediately evaporates or is taken up by plants), runoff (R, water that flows across the land surface), and infiltration (I, water that seeps through the soil). Arrows coming out of the block in the infographic change size as the amount going into each component increases. The size of the arrows is proportional to the amount of rainfall; larger rainfall amounts will always lead to larger amounts of water coming out and thus bigger arrows. To the right of the cube of land is a bar graph showing the distribution of water. This bar graph shows the percent of water going into each category (ET, I, or R). The size of the bar graph is the same for every storm size. If more than 5 cm of rainfall will become runoff, an exclamation point will appear at the top of the bar graph. The colors of the bar graph match the colors of the arrows and the colors of the numbers in the text boxes.
A few more notes about using this model: First, it is possible that the sum of the amount of infiltration, runoff, and evapotranspiration will not add up to exactly the total rainfall. This is due to rounding in the model. This model is also not predicting flooding; it is only predicting the distribution of water between infiltration, runoff, and evapotranspiration. A true flooding model is much more complicated. To predict flooding you need a great deal of detail about the whole landscape and years of historical weather and flooding data. This micro site model is only a simplified way of demonstrating the effects of different land cover and soil types on water distribution.
How to Use the Site Storm Model
print this section
The M?odel My Watershed (MMW) Site Storm Model simulates storm runoff and water quality by applying the T?R-55 and S?TEP-L water quality models for a single 24-hour rain storm over a selected land area within the continental United States. The results are calculated based on actual land cover data (from the U?SGS National Land Cover Database 2011, NLCD2011) and actual soil data (from the U?SDA Gridded Soil Survey Geographic Database, gSSURGO) for the selected land area of interest. The complementary MMW M?icro ?Site Storm Model performs the same model calculations on a hypothetical land parcel with a single land cover class and a single hydrologic soil group.
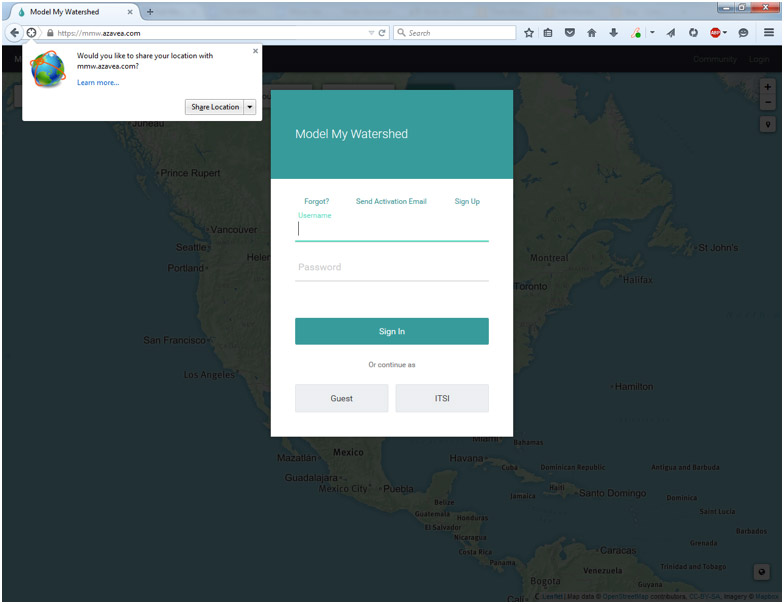
The MMW Site Storm Model can be accessed online from any web browser at mmw.azavea.com or through the through the I?nnovative Technology in Science Inquiry (ITSI) portal. When you first navigate to the MMW application, depending on your browser's settings you may be asked to share your location data with the application. Sharing your location will automatically start the application at approximately your current location, but is not necessary for the application to work. You will also immediately be given a chance to sign in to the application. Signing in allows you to save your work to return to later and to share your work with other users. For users who have registered on the site before, simply type in your username and password and click "Sign In." New users can create a sign in by clicking "Sign Up" in the upper right. For students and teachers who are using the Innovative Technology in Science Inquiry (ITSI) portal, click the "ITSI" button. This will verify your credentials for the ITSI portal and prevent you from needing to set up a new user for the application. This also allows you to quickly and easily send data and screenshots back and forth to assignments and lessons on the ITSI portal. For anyone who does not need or want to save data, you can simply click the Guest button and continue without any credentials. Logging in as a guest gives you access to the full modeling and scenario capabilities of the application, but will you not be able to save and share any data or easily send it to the ITSI portal.
Once you have logged into the application, you will see a map looking much like Google maps. If you shared your location, the application may zoom directly to your location, otherwise it will begin by showing a map of the entire U.S. As with most online map tools, you can navigate the map by clicking and dragging and zoom by pinching, using a scroll wheel, or using the zoom buttons on the upper left. You can also search for a location by name or address using the "Search" box on the upper left. To go or return to your current location, hit the My Location button with a picture of a pin below the zoom buttons on the upper left.
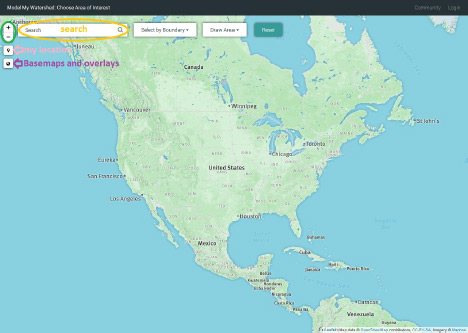
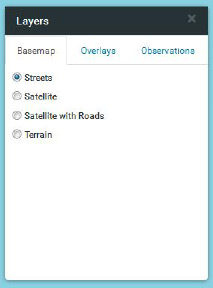
Just as Google maps allows you to switch between road and satellite maps, there are several options for both the base map and data overlays on top of the map. To access these click the button that looks like a small globe on the upper left. You can select a the basemap image and several different types of overlays. The base maps themselves come directly from ESRI or Google Maps and are not built into the application. If you have a very slow Internet connection, the base maps may be slow to load. The overlays include boundary lines (like school districts and USGS hydrologic units) and color shading for land uses and soil types. There are also observation data overlays, which display locations and data from the USGS and other national river and weather monitoring stations. Please note that observation data is not available in all locations!
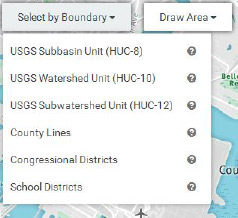
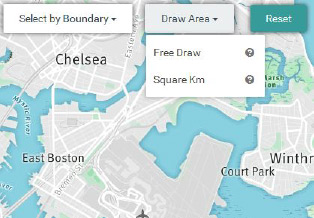
To begin modeling, you must first select a map area to model over. Do this with either the Select by Boundary or the Draw Area tool on the top part of the map (next to the search bar). You can select by political (county lines, congressional districts, and school districts) or major watershed (HUC 8-12) boundaries in the Select by Boundary tool. Once you have selected a boundary type those borders will appear on the map and the name of each region will appear as you hover over it. Be aware of your zoom level when selecting by boundaries. If you are at too high of a zoom level, you may not be able to see the boundaries on your map. You can use the Draw Area tool to draw a precise area of any size you want by drawing points on the map and double clicking or clicking on the first point to close the box. You can also use the Draw Area tool to select a 1 km box centered where ever you click.
As soon as you have selected an area or closed the box of your custom area the application will change into geospatial analysis mode. The left side of the screen will now show the area you selected in bright colors with the rest of the map greyed out. The right side of the screen will show two panes, one with analysis of the existing land cover and soil types in your selected area, the other with the option of running a model to predict runoff and nutrient loads for the area. These calculations and analysis are done on the fly for each area based on nationally available data. You will n?ot get some pre-computed estimate or canned number. These are real values based on the most recently available national land cover and soil type datasets. Because of this, the analysis may take a few seconds to compete and you may see a loading wheel on the right portion as this happens. (It is generally very fast with a good Internet connection.)
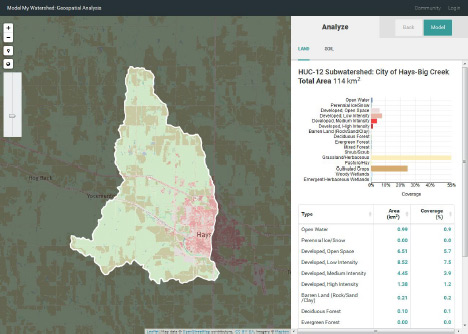
In the analyze pane at the right of the screen, you can view the land use and soil type in both tabular and graphical form. (The table is below the graph. If you cannot see it, scroll down.) Use the tabs at the top right of the pane to switch between land use and soil type. You can sort the tabular data by type, area, or coverage percent. The bar graph coloring will match up with the colors assigned by the National Land Cover Database and can be used as a legend for the land cover and soil group overlays. The title at the top of the analyze pane will list the name of the area (if selected by boundary) and the total size of the area. You can still change the map zoom and overlays in the map pane. Try turning on the NLCD overlay to compare the layout of land covers on the map to the percent of each land cover in the area. To see a larger area of the map, the analyze pane can be minimized by clicking the arrow in the upper right of the pane.
If you realize you made a mistake in selecting your area, hit the back button next model button at the top right of the page. You will be taken back to the choose area of interest screen. To clear the map and select something new, click the teal Reset button at the top of the screen. If you are happy with the area you selected, you can move on to modeling and modifying the area by clicking the teal Model button on the upper right pane.
Once you have entered the modeling mode, the application will show tabs at the top of the screen for the current conditions and a new scenario where you can modify the landscape by changing the land cover type or applying conservation practices.The model tab will now be filled out with predicted amounts of runoff and stream water quality. The runoff quantities are calculated using a combination of the T?R-55 r?unoff model developed by the US Department of Agriculture and the Small Storm Hydrology Model for Urban Areas developed by Robert Pitt for a single 24-hour rain storm. The water quality parameters are calculated using the EPA's S?TEP-L ?water quality model. For more information on the specifics of these calculations, see other documentation. The runoff tab in the model output pane shows the partitioning of the rainwater into runoff, infiltration, and evapotranspiration as a stacked bar graph. In the water quality tab, you will see both tabular and graphical data showing predicted water quality for any streams in the selected area. Because the model is running with real data on your custom area, it make take some time for the model to run and you may see a loading icon. (It is generally very fast with good internet connection.) The entire model output pane can be minimized by clicking on the arrow in the upper right of the pane.
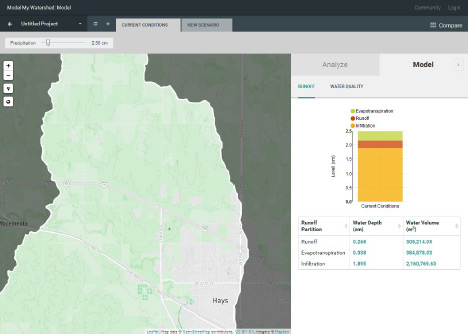
When you begin modeling, you will always begin in the current conditions tab. In this tab, you see the analysis and resulting model of the land exactly as it is. The only thing that can be changed in the current conditions tab is the quantity of rainfall to model.
To begin making changes to the landscape, click on the new scenario tab at the top of the screen. To start this looks exactly like the current conditions tab but with two tool boxes in the upper left, one for land cover and another for conservation practices. Each of these is a free-hand drawing tool to modify the current land use. The model output pane also changes to show the original results from the current conditions tab and the modified results as you change the landscape. (The analysis pane will not change.) Select a land use or conservation practice from the toolboxes at the top of the screen and then click points on the map to draw an area over which to apply it. As soon as you add a new land use or conservation practice, the model will re-run in the background to calculate what has changed and all of the plots will be updated. You will see loading icons again in the model pane as this happens. Remember that you can minimize the model output pane to give more screen space to work on landscape modifications. See other documentation for an explanation of how the runoff and water quality contributions of conservation practices are calculated.

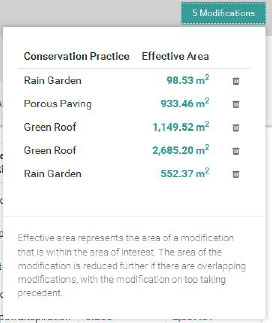
As you add modifications, you can see details about amount of area modified by clicking on any modification box. You can also see a list of all of the modifications you made in the scenario by clicking on the space in the upper right of the map pane where it says x modifications. This gives a sort of shopping cart of modifications grouped by the type of modification. You can delete any modification by clicking the trashcan next to it. If it helps to decide where to make changes, you can still use the small globe icon to select which overlays to display on the map.
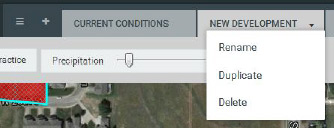
You can create many possible scenarios of landscape modification by clicking on the + next to the current conditions tab. This opens up a new tab with no modifications on it. You can also make a copy of one scenario and further modify it by clicking on the arrow on the scenario tab and selecting duplicate. Scenarios can be renamed, deleted, and, if you are logged in, shared through the same menu. To help sort through many scenarios, click on the three-lined hamburger button next to the Untitled Project tab.
Once you have created several scenarios, you can compare all of them by clicking Compare in the upper right or the tab bar. This gives a side-by side comparison of all of the scenarios along with the original conditions before any modifications. It also shows what the partitioning would be if the landscape were 100% forested. This 100% forested condition will give the maximum amount of infiltration for the landscape, given its soils. At the top is a map showing the original area and modifications. Below that you can select which type of model output you would like to compare. The same model will apply to all scenarios. At the bottom of the screen there is a list of all the modifications made in each scenario. To scroll through many scenarios, use the arrows on the bottom right of the screen. To return to your scenarios, click the arrow next to Navigate Scenarios in the bottom left of the screen.

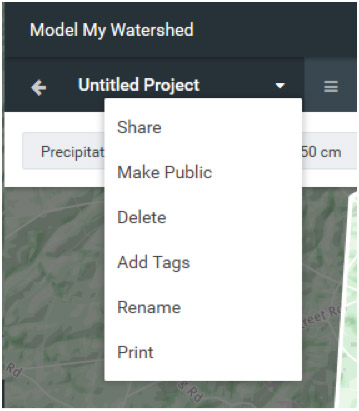
At any time while working, you can name and save your work by clicking on the top left Untitled Project tab. You can also make the project publicly accessible to anyone with a link to it, add tags so it can easily be found, print out the maps and graphs, or embed the work into the ITSI portal. Note that this only works if you logged in when you entered the application (and embedding in the ITSI portal requires logging in through the ITSI portal). If you have made your project publicly accessible and given someone the link, they will be able to view all of your scenarios and results. They will not, however, be able to modify it. Any public project can be made private again from the same menu.
PART 1 - EXPLORING MY WATERSHED
Being Prepared
Students will enroll in your class by using the class word before beginning Day 1.
If you need assistance, use the tutorials located in the HELP section of the ITSI portal.
Before beginning part one, students should have prior knowledge of the water cycle, including the terms: Evapotranspiration, Run-off, Infiltration, Precipitation, Evaporation, and Condensation. Students should have a background in point source (sewer and industrial pipe outfalls) and non-point source (agricultural runoff, urban runoff) pollution.
Using MMW for DAY 1:
- Put the address of your school in the search bar.
- Select the HUC basin boundary in the drop down menu. Click on your school to identify your watershed boundaries. You may need to zoom in/out to view all of the businesses, land cover types (farm, turf grass, forest, etc), and local waterways within your watershed boundary.
- Click the Satellite image overlay.
- Use the data from the land cover to analyze your watershed health.
- Determine the effects the neighbors (businesses, golf courses, farms, houses, etc.) have on the local watershed - do they produce harmful run-off, do they help to clean the water that is infiltrating, etc.
Safety
None
Getting Started
The ITSI portal contains all materials needed for students to engage in this activity.
Materials
For this activity each student will need access to a computer or tablet. (**If necessary, students can work in pairs. In pairs, one student will log on to ITSI and invite the other student to join. This will create a group logon and each student will have their activity information filled in once they hit submit.)
It may be beneficial for you to print out Day 1: Exploring my watershed from the ITSI portal. To do this, click the print button in the top right corner of the page. If students need assistance reading the article, you can make additional copies as needed.
Suggested Timeline
The activity is designed to be completed in a 45 minute period.
Thinking about the Discovery Questions
The following are the big ideas that pertain to this set of activities:
- What is a watershed?
- A watershed is all of the land where rain drains to a single outlet. Watersheds are nested. Larger watersheds are made up of smaller ones. For example, the Mississippi is made up of the Ohio, the Missouri and the Arkansas, among others.
- Do you live in a watershed?
- Unless you live on a boat in the middle of the ocean, you live in a watershed.
- How can you be a good watershed neighbor?
- Water flows down hill. What ever washes into the water is carried downstream. You can be affected by what happens upstream and what you do affects those who live downstream. You wouldnt throw trash in your neighbors yards so you should not throw pollution into the river that flows past your neighborhood.
Learning Objectives
ESSENTIAL QUESTION: How do the actions of one neighbor impact all members of the watershed?
Driving Question: How can we be good watershed neighbors?
Learning Objectives
- Students will be able to identify and describe their watershed.
- Students will explain how the land that makes up a watershed is connected and how the actions of one member of a watershed impact all other members of the watershed.
Discussion: Setting the Stage
In this activity you will examine:
- Q: What is topography?
- A: The physical features of the land, i.e. mountains, valleys, hills. Water takes the path of least resistance and will always run downhill.
- Q: What is a watershed?
- A: A watershed is the land where all rain that falls there flows to the same stream or river.
- Q: How are areas in a watershed connected?
- A: Because all of the rain that falls in a watershed drains into the network of streams and ends up at the mouth of the largest stream or river, everything that is on the land can wash into the stream or river. That means that what someone is doing upstream effects people who live downstream. (Upstream areas are at a higher elevation in the watershed and drain smaller areas. Downstream areas are lower in elevation in the watershed and any contaminants that flow down from the headwaters (upstream) can contaminate the water downstream.)
- Q: What activities or land practices are happening upstream in your watershed and why does it matter?
- A: Ask the class whether there is agriculture upstream. If so, is it row-crops, pastures, or confined animal operations, or a mixture (like a dairy farm)? Have them describe how this could affect the watershed (sediments, manure and fertilizer can wash into the streams causing algae blooms and muddy water) . If there are areas with housing developments, ask them how they think this will affect the watershed (increased runoff that can cause flooding and erosion of stream channels.)
- Q: Ask the class whether they think their schoolyard is a good watershed neighbor.
- A: Ask them whether there are impervious surfaces (paved areas) in the school yard. If so, how much of the school yard is paved and what do they think the outcome of this is? What about playing fields? What do they think that these will do? Mowed playing fields are compacted, fertilized and treated with chemicals, so excess nutrients and chemicals wash into the stream and can cause algae blooms and other water quality problems.
Discussion: Formative Questions
These will be used during the activity by the teacher to ask groups/students or whole class.
- Q: Where else can water in the watershed go besides into streams and rivers?
- A: Water can runoff over the surface of the land, soak into the ground (infiltration), evaporate into the air (evaporation) or be taken up by plants and released into the air (transpiration). The term evapotranspiration is the combination of evaporation of water off of surfaces and transpiration from plants.
- Q: What areas in the schoolyard do you think cause the most runoff?
- A: Paved surfaces such as parking areas cause runoff of most of the water that falls on them. The remainder evaporates into the atmosphere. However, turf grass can also causes up to 50% of the water that falls on it to runoff. This is because mowing compacts the soil, making it more difficult for the water to soak in. How much of your schoolyard is turf grass compared to pavement? If your schoolyard has large grassy areas, it may be causing as much runoff from the grass as from the paved areas.
- Q: What areas of the schoolyard do you think cause the least runoff?
- A: Unmowed areas can infiltrate more water, as can areas with trees and shrubs.
- Q: Where does infiltrated water go? What good can it provide once it infiltrates?
- A: Water that infiltrates into the ground continues to percolate downwards with the pull of gravity. Some of this water will emerge later (hours, days) later as stream flow be seeping slowly though the soils towards a stream. A lot of this water will continue downwards into the Earth until it reaches a saturated zone called an aquifer, an underground layer of sediment or rock that can store water like a sponge in its pore spaces. Sandstone is a great example of a rock type that can store water. This water can then much later (a few years to millenia) emerge as stream flow. It can also be used as a drinking water supply by accessing via a well.
- Q: What are wetlands and what do they do?
- A: Wetlands are low-lying areas that water flows into. It can be a depression. The soil there is nearly always wet and plants that grow there are water-loving plants. Wetlands allow water to soak (infiltrate) into the ground, which replenishes the groundwater. They are an important part of the water cycle.
- Q: Compared to the schoolyard, how does your own home handle rain that falls on it?
- A: Ask students to describe their home and if they have a yard or open space where they live. Is this area heavily paved? Remind them that the roof of their home also causes runoff. If they have a lawn, it also causes runoff (~50% of the rain). Ask them how much roof and driveway they have compared to lawn area. Which (paved or lawn) do they think causes the most runoff on their property?
Discussion: Wrapping Up
- Q: Before we started, how did you think your school yard affected the watershed?
- A: Ask students whether they thought that the schoolyard was a problem for the watershed. What do they think now?
- Q: How do you think your yard or the area around where you live affects the watershed?
- A: They should describe their neighborhood and decide if it is a good watershed neighbor and why.
- Q: What do wetlands do for the watershed? How?
- A: They should describe how wetlands are low areas in the watershed that soak water into the ground rather than running off overland into streams and rivers. They can decrease flooding and recharge groundwater aquifers.
- Q: What is the most problematic part of the school yard? What is the best part for the watershed?
- A: Have the class make a list of areas in the school yard and rank them from best to worst. Please introduce a career profession that students do not usually think of as STEM - that must be knowledgeable about water. One is provided in the activity...so make sure to introduce it and answer any possible answers to the question.
Career: Landscape Architect - Landscape architects not only design beautiful gardens, they also build landscapes that are good watershed neighbors. They make sure that the majority of the rain that falls on the ground is infiltrated. They use native plants that support wildlife. To be a Landscape Architect, you need to understand ecology (the study of plant communities), soil science (the characteristics of soils and what vegetation they can support) and engineering (modifying the land surface to reduce runoff). You also need to be a designer who makes landscapes beautiful as well as functional.
Additional Background
All land is comprised of watersheds. The smallest streams (headwaters) have small watersheds that flow into and join with other small streams to make larger streams and watersheds. This nested structure continues to the largest rivers that eventually discharge into lakes or oceans. The largest watershed in the US is the Mississippi River watershed, which drains more than half of the land in the continental US. There are many more miles of headwater streams than larger rivers, and so the majority of the land is part of small headwater watersheds.
Vocabulary
Evaporation is when water turns from a liquid to a gas. That gas is water vapor, where the water molecules are suspended in the air. Warm air holds lots of water molecules, which is why it feels more humid in warm weather.
Evapotranspiration the combined processes of evaporation and transpiration.
Infiltration is the process of water soaking into the ground.
Photosynthesis is the process that green plants use to make food from carbon dioxide it gets from the atmosphere and water it gets from the ground through its roots.
Pollution chemicals, pathogens and other harmful things that could have bad effects on people and other living things.
Runoff water that does not soak into the ground but runs across the surface of the land into streams, rivers, lakes or storm-water basins and sewers.
Topography - The physical features of the land (mountains, hills, valleys, etc).
Transpiration - is the process that plants do when they take up water to support photosynthesis then release water back into the atmosphere through evaporation.
Watershed - is all of the land where any rain that falls runs into the same stream, river or lake. It includes the hills, valleys, towns, farms and any other land, even rivers, lakes and wetlands where the water goes.
Wetlands low areas that water flows into and where the soil is almost always wet through most or all of the year. There may or may not be water visible at the surface.
Analysis
Questions from the activity with answers are provided below.
- Q: What did you learn about your schoolyard?
- A: Have students discuss what areas they felt were the most beneficial to the watershed and which were the most problematic.
- Q: Can some of the problem areas be changed? If so, how would they change them?
- A: Have the students rank problem areas by whether they can be eliminated or changed.
- Q: What areas cannot be eliminated because they are too important to activities at the school?
- A: Have students list areas that cannot be eliminated. Keep this list because in a later lesson, they will learn how some surfaces can be made more watershed friendly.
- Q: How do their own homes and neighborhood compare to the school yard? Are they better or worse?
- A: Have students think about their own yard and compare it to the schoolyard. Also, ask them about areas in their neighborhood that they think are good for the watershed or bad for the watershed? Ask them to explain why they think they are good or bad. Keep this list so that later students can suggest ways to improve them.
- Q: Ask students if they know anyone they think is a watershed professional and what they do?
- A: This is a good place to introduce professions such as civil engineer (an engineer who modifies the land surface for development and remediation), hydrologist (someone who studies water in the landscape), geomorphologist (someone who studies the land surface, including how streams and rivers form the landscape), ichthyologist (someone who studies fish), aquatic entomologist (someone who studies insect larvae to determine water quality).
Further Investigation
In completing the at home activity students will be taking pictures using their own device. If students do not have access to a camera, they can sketch pictures of the outside of your home and yard/neighborhood for use in your snapshot album.
The pictures need to be saved to a computer prior to uploading to ITSI. To upload the pictures to the snapshot album on ITSI, students will need to click on the button.
PART 2 - MANAGING WATER
Being Prepared
This activity will occur in the classroom. Students will need a device that can access the ITSI portal.
Safety
None
Getting Started
The activity begins with a short reading followed by an investigation using the Micro Site Storm Model in the ITSI portal. The ITSI portal contains numbered directions that students can follow detailing how to use the Micro Site Storm Model.
Below is a listing of some guidelines to follow to ensure student success in using the Micro Site Storm Model app:
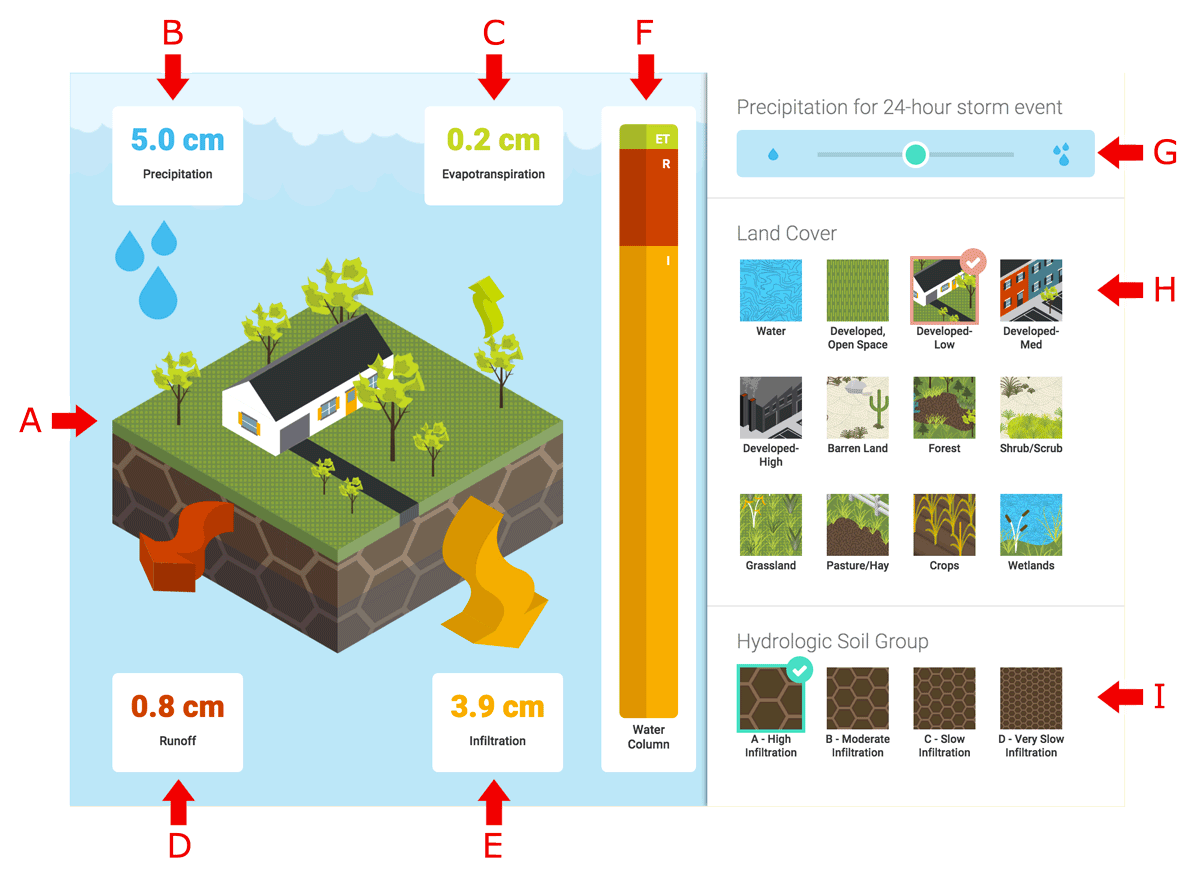
TABLE 1: Micro Site Storm Model components
- Orient the students to the various components of the app (see Table 1 above as well as descriptions below that reference this table).
- On the left side of the screen (A) students will see a visual depiction of a particular land cover type. Framing this picture will be four rectangles each containing data on the amount of precipitation (B), evapotranspiration (C), runoff (D) and infiltration (E) one would expect for a single storm event.
- The middle of the app has a water column (F) that will give students a visual representation of the evapotranspiration, runoff and infiltration amounts displayed for each land cover.
- Along the right side of the app are sections where students are able to choose from a variety of variables to test their effect on the movement of water on the micro site. At the top is a bar (G) that allows the students to regulate the amount of precipitation. Below this bar is a section (H) that allows students to pick different land cover types followed by a section ( I ) where students can choose different soil types to test.
- Hovering over each individual land cover type will open up a box giving a description of that particular land cover.
- Make sure students have selected 5 cm of precipitation and soil type A before they start testing the effects of different land covers. They should keep these precipitation and soil conditions constant for all of the different land cover types.
- Students will have to scroll down the screen in order to transfer evapotranspiration, runoff and infiltration numbers into the data table.
- Once the data table is populated, a bar graph will be automatically generated in the space below the table. Scrolling up and down while the cursor is sitting over this graph will allow students to change its scale.
- Individually clicking on the words evapotranspiration, runoff and infiltration in the table will rank the land cover types from most to least for the specific water cycle process chosen.
- Individually clicking on the words evapotranspiration, runoff and infiltration in the graph will show bars for only the specific water cycle process chosen.
Materials
For this activity each student will need access to a computer or tablet. (**If necessary, students can work in pairs. In pairs, one student will log on to ITSI and invite the other student to join. This will create a group logon and each student will have their activity information filled in once they hit submit.)
Suggested Timeline
The activity is designed to be completed in a 45 minute period.
Learning Objectives
Essential Question How do we manage the water that falls on a watershed?
Learning Objectives:
- Students will identify how land cover, rainfall totals, and soil type determine the path water travels.
- Students will identify the impact of land cover and soil type on the health of the watershed.
- Students will predict water quality under existing and proposed conditions.
Thinking about the Discovery Questions
This activity will introduce ways that land cover, soil type and storm strength reduce runoff. The Micro Site Storm Model will let students explore the conditions that impact runoff.
Discussion: Setting the Stage
In this activity you will examine:
- how different land-cover types and soil textures affect the amount of runoff
- land-cover types that are impervious (made up of hard substances such as paving or compacted soil) cause more runoff
- how land-cover types that are not impervious (area where the water can soak in, such as natural grassland are better for the watershed
- how soil texture affects runoff (e.g., sandy soil can soak in more water than finer soil, such as clay loam)
- have students look over their schoolyard and ask them to predict what areas would cause runoff and which would soak up the water.
Discussion: Formative Questions
These will be used during the activity by the teacher to ask groups/students or whole class.
Q. How do you think your schoolyard affects infiltration and runoff?A. ask students if they have noticed areas where water forms puddles. What activity takes place there? How is the schoolyard managed (mowed frequently, paved).Q. What areas are problematic and what areas soak up water and put it back into the ground?A. Have students look over their schoolyard to see what types of landcover occur. Which ones do they think cause more runoff and which cause less? Have them try the generic model to see if their predictions are correct. Ask them to explain why they think this is the case.Q. Are there areas that are problems, but still need to be there, such as playing fields and parking areas? If these cannot be changed, what do they think could be done (directing runoff into an area where it can be infiltrated, for example)?
Discussion: Wrapping Up
Have students discuss whether their school yard is a good watershed neighbor. Then ask them to make suggestions on how it could be better (less pavement, more areas where water can soak in, etc.)
Additional Background
How the schoolyard affects the watershed will vary from one site to another. For urban schools that have paved schoolyards, it may appear that there is nothing that can be done. If you have time consult the Philadelphia schoolyard video so show how one urban school changed their environment.
Analysis
Questions from the activity with answers are provided below.
- Q: Rank the soil types in order from the amount of most runoff to least runoff.
- A: What affects the runoff from one soil type to another is the size of the particles. Sand has the largest particle sizes and therefore the most pore space that can hold water. As the sediments get finer, the pore space and water storage potential decreases.
- Q: As soil particle size decreases, what happens to the amount of runoff and infiltration?
- A: As the particle size decreases, the infiltration also decreases.
- Q: Based on what you learned about land cover types, what can you do to improve the lakes, rivers and streams in your watershed?
- A: Infiltration is the key to improving the water quality and reducing runoff in your watershed. By changing land cover (planting trees, etc.) or by treating non-changeable landcovers (adding infiltration basins next to parking lots) you can increase infiltration.
Further Investigation
In completing the at home activity students will be taking pictures using their own device. If students do not have access to a camera, they can sketch pictures of the outside of your home and yard/neighborhood for use in your snapshot album.
The pictures need to be saved to a computer prior to uploading to ITSI. To upload the pictures to the snapshot album on ITSI, students will need to click on the button.
PART 3 - CONSERVATION PRACTICES
Being Prepared
Make sure that every student has access to the photographs of Conservation Practices. They will be in the ITSI Portal, but you may also want to provide paper copies or project them as you introduce them.
Safety
None
Getting Started
In this unit, students will be introduced to conservation practices. These practices are ways that engineers and landscape architects reduce overland runoff and promote infiltration. There are photographs in the ITSI Portal of conservation practices that are used in the web application. Descriptions of those practices are included in this unit.
Materials
You will need to make sure that all students have access to the photographs of conservation practices, along with the descriptions of how they work. Each student can access the photos through the ITSI Portal. However, if there are any students who have difficulty seeing the images, it may be necessary to print them out. They should be in color to assure that details are visible. Students who are colorblind may need assistance in understanding the photographs.
Suggested Timeline
The activity is designed to be completed in a 45 minute period.
Thinking about the Discovery Questions
This unit will introduce ways that watershed professionals and homeowners can modify the landscape to reduce runoff. These practices show different ways to reduce runoff by modifying the land surface.
- Why would you want to reduce runoff?
- Runoff flows over the land, carrying potential pollution with it and can also cause flooding. The flooding can cause erosion of soil particles and also carry any problematic substance with it, such as oil, manure, gasoline, etc. If the water can soak into the soil, it can keep much of the pollution from going into the stream or river. The water not wasted as runoff can then infiltrate and be stored as groundwater that helps support stream flow during dry seasons and can be used as a drinking or irrigation water supply.
- What are the problems that runoff can cause?
- Runoff can cause erosion of sediments and movement of pollutants. Both of these can impair water quality and potentially cause flooding downstream.
- Have you ever seen flooding in your neighborhood?
- Ask students to identify where they have seen water backing up in their neighborhoods. This may be caused by large storms where the storm drains cannot handle the amount of runoff or when storm drains are clogged.
- How could you reduce runoff?
- Ask students how they think they could reduce runoff in their neighborhoods and in their schoolyard. This should be an introduction to conservation practices, which are designed to reduce runoff.
Learning Objectives
The learning objective of this unit is to introduce various ways to reduce runoff and to promote infiltration.
- students will learn about various conservation practices.
- students will match various conservation practices to sites where they will work well.
- students will examine conservation practices that will not be appropriate to their schoolyard, but could be used in their town or neighborhood.
Discussion: Setting the Stage
- Q: Have you ever seen runoff in your neighborhood or in your yard?
- A: Ask them where they saw runoff, where it went and what the water looked like (muddy, clear, floating debris, etc.)
- Q: Where did the most runoff happen (pavement, lawn, roof, other)?
- A: Most of the runoff will occur on paved surfaces. Roofs are considered the same as pavement for this analysis. However, turf grass also causes considerable runoff. Given that most residential properties have more area in lawns than they do paved/roof area, most of the runoff may be coming off of yards.
Discussion: Formative Questions
These will be used during the activity by the teacher to ask groups/students or whole class.
- Q: The last time we had a huge storm, where did you see water running off in your neighborhood?
- A: Ask students if they noticed where the water was coming from and where it went.
- Q: What surfaces contributed the runoff?
- A: Did they notice if there were particular places where there was more runoff than other places? What were they?
- Q: Can you think of any way to reduce the runoff?
- A: They should suggest ways that they think the runoff could be reduced by infiltration. If possible, they should suggest places in their neighborhood that they think already do this.
- Q: How do you think your property and neighborhood compare with the schoolyard regarding runoff?
- A: Ask students if there are places near their homes and in their neighborhoods where they see lots of water running down streets or ponding in particular areas. If so, why do they think this is happening.
Discussion: Wrapping Up
- Q: Can you think of any conservation practices that could be added to your neighborhood?
- A: Have students use the Model My Watershed map of their neighborhood to locate areas where conservation practices could be installed and which ones would work best there. They should explain why they made those decisions.
- Q: Are there any places in your neighborhood where conservation practices cannot or should not be installed, even though they create runoff? Why?
- A: There are always some areas in your neighborhood that are essential to the functions in your neighborhood. Students should identify them and say why they cannot be modified.
- Q: Since some areas cannot be changed, is there anything else that can be done to reduce runoff?
- A: It is often possible for conservation practices to be installed adjacent to an area that creates runoff. Even if there is no adjacent area, it is also possible to direct runoff to an area where a conservation practice has been installed. They should suggest where such practices could work and where they could not. Even if they think that it will never happen, they should develop a way to reconcile different activities (commercial, parking, roof area) by suggesting conservation practices that could be implemented.
- Q: How would you take what you have learned and apply it to your own yard and/or neighborhood?
- A: Let each student or group or students select an area and propose conservation practices that could be implemented there. It may be interesting to look at a shopping area where the students would propose changes. These proposals could be passed along to the local authorities for consideration. If this is done, the students should list the reasons why this would be a good thing to do.
Please introduce a career profession that students do not usually think of as STEM - that must be knowledgeable about water. If one is provided in the activity...so make sure to introduce it and answer any possible answers to the question.
Career: An Aquatic Entomologist is a person who studies insect larvae in order to test the water quality of a stream, river, pond or lake. Many insect larvae, such as mayflies and stoneflies, are very sensitive to pollution, while others, such as midges and blackflies are less sensitive. By collecting these insects, Aquatic Entomologists can calculate a score for the stream, lake or river that tells whether the water is clean. To pursue that career, you would want to have a strong background in biology and stream ecology.
Additional Background
Conservation practices are developed by landscape architects and many types of engineers (civil, agricultural, and environmental). They are designed to reduce both the amount of runoff and to improve the local water quality. In many municipalities, the increase in impervious surfaces can cause severe flooding problems. In some areas, stream banks can be deeply incised and sewers that are installed in stream banks can be exposed and break. The additional runoff can also cause flooding. In Valley Forge National Historic Park, George Washingtons Headquarters is on the banks of Valley Creek. Because of uncontrolled development in the headwaters of the creek, Washingtons Headquarters is threatened by even moderate storms and park rangers have to put sandbags around the structure to protect it. If conservation practices were implemented in headwater communities, Washingtons Headquarters could be protected.
Vocabulary
Cluster housing When developers build a community, they can build the houses closer together and leave other areas open and undeveloped where they plant trees and other plants that will soak up the rain. This reduces flooding and lets water soak back into the ground.
Rain garden - Rainwater that falls on the land drains into a specific place, a rain garden, where it soaks into the ground. It is usually small and is built in residential yards. It has plants that like wet soil and keeps the water from polluting streams and rivers, since soil helps to clean water. Without a rain garden, water runs off of the surface and it can carry mud and pollution into streams and rivers.
Vegetated infiltration basin This is like a rain garden but much bigger. It does the same thing, makes the water soak into the ground. They are built in large developments, such as schoolyards and shopping malls. The plants that live there like wet soil and help it soak into the ground.
Porous paving - This is a way to have an area where cars can park but still let water soak into the ground. Below the surface blocks, they have gravel that lets the water soak in. Because of the gravel, there is room under the parking area for the water to stay until it soaks into the ground.
Green roofs - Green roofs have plants growing on them. They keep the rain from running off the building and causing flooding and erosion. The plants soak up the rain and put it back into the atmosphere through evapotranspiration.
No-till agriculture Instead of plowing after harvesting a crop, the farmer leaves the crop residue on the field and plants the next crop right into the ground using a drill instead of plowing seeds into the soil. Like the other CPs, this practice reduces water, sediment and pollutant runoff from the land surface.
Analysis
Questions from the activity with answers should be provided for the analysis. Feel free to suggest more or better analysis questions (with answers) to be added. This is the weakest part of our activities.
- Q: Have you ever seen an implemented conservation practice? If so, where and please describe it.
- A: Have every student answer this question then discuss where these practices are located. Ask students whether they think the practices are working or not and why?
- Q: What conservation practices do you think would be the most appropriate and effective for their neighborhood and where?
- A: Have them describe what the conservation practices are, how they work and where they would be possible to implement in their neighborhood. Ask them to explain their reasoning in detail.
- Q: What conservation practices would not work in their neighborhood and why?
- A: Students should describe conservation practices that they do not think would work in their and why. They should suggest where these practices would be more appropriate and why. There should be some disagreement on this and the previous question. This may be an opportunity for a pro/con debate.
- Q: Would you be willing to reduce the area of playground or playing fields to install conservation practices in your schoolyard? Why?
- A: Again, this may be an opportunity for a debate on how to improve the schoolyard.
Further Investigation
To help students further analyze
. they can do addition that do not already exist in the activity...
- Ask students to find conservation practices in their neighborhood and photograph them with their cell phones. If they do not have cell phones or cameras, ask them to draw them and identify where they are located.
- Have students report on whether they think the conservation practices are helping to reduce runoff. If not, ask if they know why that may be (for example, do they think that the CPs are not well maintained or in the wrong place?)
PART 4 - INVESTIGATING MY SCHOOLYARD
Being Prepared
- Outline the schoolyard in the Model My Watershed application (use the satellite image overlay) and print paper copies for all students so that they can take them into the schoolyard.
- Before beginning the watershed tour, decide if you want students to be in a large teacher-led group, or in smaller groups to complete the watershed tour.
- Suggestions if it is student led small groups:
- Have a checklist for them to identify various structures, topography, vegetation, etc.
- Students may want to take pictures and create an album of each area they identify in their school yard.
- Possibly assign students to a group: 1. a vegetation group, 2. an engineering/topography group, etc. Students will look at only these specific layers of their school yard when touring.
- For ESL/ELL students or students with lower abilities, have symbols on pre-marked areas for students to find and fill in as a scavenger hunt.
- Have a report card for students to fill out that gives each area of the school yard a grade for water management (A being excellent ? F being poor water management)
Things to think about before leading a watershed tour:
- Look at the outside of the building - are gutters running in to the ground, if so, where does that water end up? Is the water running out from gutters onto the surface of the ground? What is the color of the roof, as seen by the satellite image - is it white to reduce thermal pollution?
- Walk around the school yard, and identify the topography/engineering of the land. Are there hills? If so, where is the water moving after it moves down the hill? Are there areas where a lot of run-off occurs that large rocks have been put into place to slow the water? Find the storm drains, and determine where the water is coming from and where the water is moving to.
- Possibly talk to the grounds crew/maintenance department in your district to find out what plans have been established for water management.
- Identify artificial turf/playing fields, and be able to explain how water moves off/over/into these fields. Example listed below:
Safety
Remember to check with your school policies (safety and medical) when taking students outside. You may want students to work in groups so that it is easier to keep track of them. This may vary depending on the schoolyard and the age of the students.
Getting Started
In this activity, students will use what they have learned about conservation practices to evaluate their schoolyard and make suggestions on what and where conservation practices could be installed.
Materials
Each student or group of students should have a printed paper map of the schoolyard, clipboards, and a marker.
Suggested Timeline
The activity is designed to be completed in a 45 minute period.
Thinking about the Discovery Questions
- What would you do to your schoolyard to reduce runoff and improve water quality?
- How would you make sure that changing the schoolyard would not interfere with activities that occur now in your schoolyard?
- How should your school make the decisions on what should be done?
Learning Objectives
The learning objective of this lesson is to have students apply what they have learned about conservation practices to their schoolyard.
Discussion: Setting the Stage
- Q: Where in the schoolyard have you noticed runoff during storms?
- A: Have students describe what they have noticed about where water pools during storms, where erosion results from runoff and where there are natural depressions that collect water (wetlands).
- Q: How do facilities in the schoolyard affect where water goes?
- A: Have students discuss where they see problems with stormwater and what areas are relatively unaffected by heavy rains.
Discussion: Formative Questions
Based on the questions students answered about their neighborhood, have them do a similar analysis of the schoolyard.
- Q: What areas in your schoolyard get flooded during a heavy rain storm?
- Have them identify them on their maps with an I for impervious.
- Q: Are there any conservation practices in their schoolyard?
- Have the students mark them with CP on their map for conservation practices.
- Q: Are there any places in the schoolyard where water soaks in?
- A: Have the students mark those areas with a P for porous.
Discussion: Wrapping Up
Have the students post their maps for comparison. Where maps disagree, have a discussion on why different individuals or groups categorized the areas differently. If the discussion does not produce a consensus, students need not change their designation but should justify it.
They should also discuss the following questions:
- Q: How much area in the schoolyard is impervious?
- A: Students should outline the areas that are impervious and estimate what percentage that is of the schoolyard.
- Q: Are there any CPs in the schoolyard and what are they?
- A: Each group or individual should propose what they believe is a conservation practice in the schoolyard and why they would designate it as such. If there are disagreements, have students discuss their opinions.
- Q: Are there any areas in the schoolyard that they designated as porous? Why?
- A: Ask why they designated an area as porous. If there are any disagreement students should discuss this.
Please introduce a career profession that students do not usually think of as STEM - that must be knowledgeable about water. One is provided in the activity...so make sure to introduce it and answer any possible answers to the question.
Career: A fluvial geomorphologist is someone who studies how water shapes the landscape and in particular how streams and rivers respond to changes in their watersheds. They use a combination of hydrology, geology and engineering principles to understand why streams and rivers look the way they do and flow the way they do. They also work to restore streams and rivers that have been impacted by human activity. Geomorphology is a subject that can be studied in college, either in a geography or geology department.
Additional Background
This activity is designed to have students analyze their schoolyard and determine what its hydrologic properties are. They should be able to identify areas where water can infiltrate, whether there are conservation practices and if there are impervious areas. If possible, it may be appropriate for them to calculate the percentage of the land area that is porous, impervious or is a conservation practice.
Vocabulary
Impervious: An area that cannot infiltrate water, but causes the water to run off to another area.
Porous: An area that is capable of infiltrating (soaking up) water and putting it into the ground.
Analysis
- Q: How would you describe your schoolyard in relation to the watershed? Is it a good watershed neighbor or not? Explain.
- A: Students should be able to categorize the impact of their schoolyard on the watershed and provide supporting evidence. How do they think it compares with other areas in their watershed (better, worse or the same)? Why?
- Your home is part of this watershed. Make a prediction as to how your home and neighborhood will compare to the schoolyard. Does your home have any CPs, do your neighbors have any CPs?
- A: Have students share their predictions and introduce the further investigation for homework.
Further Investigation
To help students further analyze:
- Have students look around their neighborhood and identify areas that are impervious or porous and take pictures of them.
PART 5 - TRACKING MY SCHOOLYARD
Being Prepared
Before beginning part one, students should have prior knowledge of the weather parameters they will be measuring, including the terms: Relative humidity, temperature, soil moisture and ambient light.
The Watershed trackers are sensitive pieces of equipment, so students should be instructed on their proper handling and care prior to their use in order to prevent damage.
The process of inserting the Watershed Tracker into the ground to take soil moisture readings requires students to be very precise and follow the same procedure each time they insert the probe in a different location. Because of the precision required to replicate these steps, you may want to have the Watershed Trackers already inserted in the ground at different test sites and have the students rotate to them to take readings rather than having the students insert them into the ground each time (especially if your students are younger or lack experience working with probes).
Students will need to have access to a mobile device that accepts Bluetooth signals. These devices will have to have the Watershed Tracker app loaded on to them prior to pairing them with the Watershed Tracker probes. This app may be loaded for free from the Google Play store for Android devices and from the iTunes store for iOS devices. Check ahead of time to see how many students have devices that will run the Watershed Tracker app. Also, follow any procedures outlined by your school to notify parents that an app will need to be loaded on their son or daughters personal device. Tables 2 and 3 (below) contain pictures and descriptions to help you find and download the app to your mobile device.
Table 2: Installing the app on Android devices
| 1) Search for Watershed Tracker in the Google Play store. If you are unable to find it, search for all Concord Consortium apps and it should come up as one of the options (see above). | 2) Above is a close up view of what the Watershed Tracker icon looks like. | 3) Above is a view of the window that provides information on the Watershed Tracker app and prompts you to install it on your mobile device. |
Table 3: Installing the app on iOS devices
| 1) Open the App Store app on your iOS device by tapping its icon. | 2) Search for Watershed Tracker. | 3) Tap the "Get" button to install the Watershed Tracker app on your device. |
Safety
Remember to check with your school policies (safety and medical) when taking students outside. You may want students to work in groups so that it is easier to keep track of them. This may vary depending on the schoolyard and the age of the students.
Some of the materials to be used have sharp edges (garden spade, scissors, stakes), so care should be used when handling these items. Other equipment, such as the rope, string and fishing line, should be used as instructed and should not be wrapped around any body parts.
Getting Started
Displaying Data from the Watershed Tracker on your mobile device:
- Open up the Watershed Tracker app on your mobile device.
- Turn on one Watershed Tracker probe at a time and wait for it to show up on your screen. Make note of the number that is assigned to each probe so they are easy to track if multiple ones are being used at one location. Table 4 (below) contains pictures and descriptions to illustrate what the display will look like on your device once it is paired with a Watershed tracker.
Table 4: Watershed Tracker app display
| 1) Once the app detects a Watershed Tracker probe is nearby, it will display a line of text listing its identification number. Tap on this number to open up the window that will display the data it is recording. | 2) Close up view of the Watershed Tracker data display (above). As you can see, the app displays humidity, temperature, moisture and light data. A disconnect button under the data display can be used if you want to stop streaming data from one Watershed Tracker probe and try to connect to a different one. |
Using the Watershed Tracker probe in the field:
- To get the most accurate relative humidity and light readings with the Watershed Tracker, it should be held 1.25 to 1.50 meters above the ground. It is suggested the probe be tied to a tree branch or post when making these readings.
- To get soil moisture readings, the sensor blade of the Watershed Tracker must be inserted into the ground (do not insert the plastic housing of the tracker under the soil or under water). The process of inserting the Watershed Tracker into the ground to take soil moisture readings requires students to be very precise and follow the same procedure each time they insert the probe in a different location. Failure to replicate the process in a similar fashion each time may lead to varying or inaccurate readings. Table 5 (below) contains pictures and descriptions to help you insert the Watershed Tracker into soil.
Table 5: Inserting the Watershed Tracker in the soil
| 1) Use a garden spade to place a slot in the ground at a 45 degree angle. The hole you make should be deep and wide enough for only the sensor blade of the tracker to fit in. | 2) Gently push the Watershed tracker into the slot you made in the ground (tracker should also sit at a 45 degree angle). Make sure to insert only the sensor blade (do not cover the housing of the tracker with soil). | 3) Use the garden spade to gently pack the dirt around the sensor blade. Soil must be packed exactly the same each time the tracker is inserted into a different hole for the readings to be accurate. |
Materials
- topographic map of your local schoolyard and watershed (if available)
- aerial photos of your local schoolyard and watershed (if available)
- four small wooden or plastic stakes
- rope
- measuring tape or stick
- Watershed Tracker
- string or fishing line
- scissors
- garden spade
- Mobile device: Android that has BLE (Bluetooth Low Energy, Bluetooth 4.0 or Bluetooth Smart) or an iPad or iPhone
Suggested Timeline
The activity is designed to be completed in a 45 minute period.
Thinking about the Discovery Questions
How does my schoolyard impact my local watershed?
Learning Objectives/Standards
- Students will collect data about their schoolyard using the Watershed Tracker.
- Students will organize soil moisture, light, temperature and relative humidity readings into simple charts and graphs to identify relationships and patterns.
- Students will compare data from different test sites in their schoolyard to determine how the ground cover impacts their local watershed.
Standards
National Science Education Standards (NSES)
NSES Earth and Space Science Structure of the Earth System
Water, which covers the majority of the earth's surface, circulates through the crust, oceans, and atmosphere in what is known as the water cycle. Water evaporates from the earth's surface, rises and cools as it moves to higher elevations, condenses as rain or snow, and falls to the surface where it collects in lakes, oceans, soil, and in rocks underground.
NSES Earth and Space Science Structure of the Earth System
Clouds, formed by the condensation of water vapor, affect weather and climate.
Next Generation Science Standards (NGSS)
Disciplinary Core Ideas
- ESS2.A: Earths Materials and Systems
- The planets systems interact over scales that range from microscopic to global in size, and they operate over fractions of a second to billions of years. These interactions have shaped Earths history and will determine its future.
- ESS2.C: The Roles of Water in Earths Surface Processes
- The complex patterns of the changes and the movement of water in the atmosphere, determined by winds, landforms, and ocean temperatures and currents, are major determinants of local weather patterns.
- ESS3.C: Human Impacts on Earth Systems
- Typically as human populations and per-capita consumption of natural resources increase, so do the negative impacts on Earth unless the activities and technologies involved are engineered otherwise.
- ETS1.A: Defining and Delimiting Engineering Problems
- The more precisely a design tasks criteria and constraints can be defined, the more likely it is that the designed solution will be successful. Specification of constraints includes consideration of scientific principles and other relevant knowledge that are likely to limit possible solutions.
Practices
- Planning and Carrying Out Investigations
- Planning and carrying out investigations in 6-8 builds on K-5 experiences and progresses to include investigations that use multiple variables and provide evidence to support explanations or solutions
- Collect data to produce data to serve as the basis for evidence to answer scientific questions or test design solutions under a range of conditions.
- Constructing Explanations and Designing Solutions
- Constructing explanations and designing solutions in 6-8 builds on K-5 experiences and progresses to include constructing explanations and designing solutions supported by multiple sources of evidence consistent with scientific ideas, principles, and theories.
- Construct a scientific explanation based on valid and reliable evidence obtained from sources (including the students own experiments) and the assumption that theories and laws that describe nature operate today as they did in the past and will continue to do so in the future.
- Engaging in Argument from Evidence
- Engaging in argument from evidence in 68 builds on K5 experiences and progresses to constructing a convincing argument that supports or refutes claims for either explanations or solutions about the natural and designed world(s).
- Construct an oral and written argument supported by empirical evidence and scientific reasoning to support or refute an explanation or a model for a phenomenon or a solution to a problem.
- Asking Questions and Defining Problems
- Asking questions and defining problems in grades 68 builds on grades K5 experiences and progresses to specifying relationships between variables, and clarifying arguments and models.
- Define a design problem that can be solved through the development of an object, tool, process or system and includes multiple criteria and constraints, including scientific knowledge that may limit possible solutions.
Crosscutting Concepts
- Cause and Effect
- Cause and effect relationships may be used to predict phenomena in natural or designed systems.
- Scale Proportion and Quantity
- Time, space, and energy phenomena can be observed at various scales using models to study systems that are too large or too small.
- Influence of Science, Engineering, and Technology on Society and the Natural World
- All human activity draws on natural resources and has both short and long-term consequences, positive as well as negative, for the health of people and the natural environment
- The uses of technologies and limitations on their use are driven by individual or societal needs, desires, and values; by the findings of scientific research; and by differences in such factors as climate, natural resources, and economic conditions.
Discussion: Setting the Stage
- Q: Why are parameters such as soil moisture, light, temperature and relative humidity important things to measure and keep track of in a watershed?
- A: Measuring soil moisture, light, temperature and relative humidity in watersheds is important mainly because these factors affect the growth of plants (relative humidity and soil moisture affect plant growth and rates of evapotranspiration, plants grow best in certain temperature ranges, light promotes plant growth by affecting rates of photosynthesis, etc.). Vegetation on the land in turn greatly affects the amount of runoff and infiltration during precipitation events.
Discussion: Formative Questions
Once students have completed an analysis of the data they collected for their schoolyard have them identify which set of conditions listed below had higher readings for soil moisture, light, temperature and relative humidity and then have them postulate reasons why they got those results.
- shaded areas vs. sunny areas
- area with trees area vs. area with no trees
- area with bushes and low vegetation vs. area with no vegetation
- area near a downspout vs. area away from a downspout
- area near an impervious surface vs. area away from an impervious surface
- hill vs. a low-lying area
Discussion: Wrapping Up
After completing this activity have the students answer the following questions:
- Q: How might the implementation of Conservation practices in our schoolyard affect the type of soil moisture, light, temperature and relative humidity readings that we get?
- Q: Are you able to find any trends or relationships between certain types of features in your schoolyard and the increase or decrease in one of the parameters (soil moisture, light, temperature, relative humidity) you measured.
Additional Background
This activity is designed to have students analyze how environmental factors are related to the hydrologic properties of certain features of their schoolyard.
Vocabulary
Relative humidity: a ratio (expressed as a percentage) comparing the amount of water vapor contained in air of a certain temperature versus how much water vapor that same air would contain if it were completely saturated.
Soil Moisture: the quantity of water contained in the soil
Temperature: measure of the amount of heat (kinetic energy) in a given area.
Analysis
- Q: How does the data you collected with the Watershed Tracker support your assessment of our schoolyard as being a good or bad watershed neighbor?
- A: Students should be able to categorize the impact of their schoolyard on the watershed and provide supporting evidence. How do they think it compares with other areas in their watershed (better, worse or the same)? Why?
Further Investigation
Have students borrow Watershed Trackers to take to their own houses. Have them walk around their yard and take soil moisture, temperature, light and relative humidity readings at different spots. Have them take pictures of each test spot and compare them to similar spots in the schoolyard to see if they find any relationships.
PART 6 & 7 - MODIFYING MY SCHOOLYARD
Being Prepared
Before beginning Days 6 & 7 it is advised to review the previous day activities and discuss with students.
Using MMW for Days 6 & 7: Below there are instructions listed for the specific activities the students will be completing. To find more specific instructions on how to use Model My Watershed Model, please refer back to the beginning of the teacher guide, labeled Prior to the start of your unit.
Selecting the area:
- Click on the Model My Watershed Model
- Put in your school address in the search button.
- Draw a 1 square mile box around your school by using the drawing tool. Click your mouse over the center of your school to create the square kilometer area. Click the arrow at the left of the black bar in the middle of the page to zoom into the square area. From this zoomed in view, you can click the green Analyze button to see the land cover analysis. Click reset to remove your original drawing.
- This 1 square mile box will define the area of the watershed that you will be re-designing using conservation practices and land-cover changes.
- Click on the Green Model button on the lower right side of your screen to run the watershed model for the 1 square mile area. In the Runoff tab, you will see charts comparing the hydrology of the existing conditions and a hypothetical 100% forest condition. You can click on the Water Quality tab to see water quality comparisons.
Modifying your area:
- Previously you were working in the Current Conditions view. If you click on the New Scenario tab, you will now be able to modify land cover and implement conservation practices on your selected area.
- By using the +land cover and +conservation practice tools you can create small areas within your selected work area to manipulate and re-run through the model.
- If you make a mistake, double click to finish your drawing, select the area by clicking on it, and then select the trash can icon that appears in the pop-up window.
- Students will record the water quality data in the chart for the current condition, the 100% forest, and their further modified scenarios.
- Students will compare the water quality scores between the the current condition, the 100% forest, and their further modified scenarios.
Students will answer the question: Based on the information you learned in earlier units, how would you explain why they are different?
- To draw in CPs, select the type of CP you wish to implement under the Conservation Practice drop down menu.
- If you make a mistake, or want to delete a CP you have drawn, click on the CP area, and select the trash can icon. There is also a green modification button on the top right of the screen. Click on this to view all modifications made, as well as, delete those you no longer wish to have.
- Click the grey arrow on the lower right side of the screen to view the watershed model.
- Students will make a list all of the CPs and land-cover changes that you implemented.
- For each change, students will provide the scores before the change, the score after the change and the difference between them.
- Students will answer the following questions: Were there any CPs or land-cover changes that you deleted? Why? Did you replace them with other changes?
- Once you have implemented CPs, students will determine the amount of evapotranspiration (ET), runoff (R) and infiltration (I) for all model runs.
Safety
None
Getting Started
The ITSI portal contains all materials needed for students to engage in this activity.
Materials
For this activity each student will need access to a computer or tablet. (**If necessary, students can work in pairs. In pairs, one student will log on to ITSI and invite the other student to join. This will create a group log on and each student will have their activity information filled in once they hit submit.)
Suggested Timeline
The activity is designed to be completed in two 45 minute class periods.
Thinking about the Discovery Questions
- How can I improve my watershed
.starting with my own schoolyard?
Learning Objectives/Standards
- Students will be able to describe the impact of best management practices on the watershed.
- Students will design a watershed plan for their school yard that maximizes the health of the watershed by implementing best-management practices and land cover changes.
Performance Expectations
- MS-ETS1-2 Evaluate competing design solutions using a systematic process to determine how well they meet the criteria and constraints of the problem.
- MS-ETS1-3 Analyze data from tests to determine similarities and differences among several design solutions to identify the best characteristics of each that can be combined into a new solution to better meet the criteria for success.
- MS-ETS1-4 Develop a model to generate data for iterative testing and modification of a proposed object, tool, or process such that an optimal design can be achieved.
Disciplinary Core Ideas
- ETS1.B: Developing Possible Solutions
- A solution needs to be tested, and then modified on the basis of the test results, in order to improve it.
- There are systematic processes for evaluating solutions with respect to how well they meet the criteria and constraints of a problem.
- Models of all kinds are important for testing solutions.
- ETS1.C: Optimizing the Design Solution
- The iterative process of testing the most promising solutions are modifying what is proposed on the basis of the test results leads to greater refinement and ultimately to an optimal solution.
Crosscutting Concepts
- Influence of Science, Engineering, and Technology on Society and the Natural World
- All human activity draws on natural resources and has both short and long-term consequences, positive as well as negative, for the health of people and the natural environment.
- The uses of technologies and limitations on their use are driven by individual or societal needs, desires, and values; by the findings of scientific research; and by the differences in such factors as climate, natural resources, and economic conditions.
Practices
- Developing and Using Models
- Develop a model to generate data to test ideas about designed systems, including those representing inputs and outputs.
- Analyzing and Interpreting Data
- Analyze and interpret data to determine similarities and differences in findings.
- Engaging in Argument from Evidence
- Evaluate competing design solutions based on jointly developed and agreed-upon design criteria.
High School
Performance Expectations
- HS-ETS1-3 Evaluate a solution to a complex real-world problem based on prioritized criteria and trade-offs, that account for a range of constraints, including cost, safety, reliability, and aesthetics as well as possible social, cultural, and environmental impacts.
- HS-ETS1-4 Use a computer simulation to model the impact of proposed solutions to a complex real-world problem with numerous criteria and constraints on interactions within and between systems relevant to the problem.
Disciplinary Core Ideas
- ETS1.B: Developing Possible Solutions
- When evaluating solutions it is important to take into account a range of constraints including cost, safety, reliability and aesthetics and to consider social, cultural and environmental impacts.
- Both physical models and computers can be used in various ways to aid in the engineering design process. Computers are useful for a variety of purposes, such as running simulations to test different ways of solving a problem or to see which one is most efficient or economical; and in making a persuasive presentation to a client about how a given design will meet his or her needs.
Crosscutting Concepts
- System and System Models
- Models (e.g., physical, mathematical, computer models) can be used to simulate systems and interactions including energy, matter, and information flows within and between systems at different scales.
- Influence of Science, Engineering, and Technology on Society and the Natural World
- New technologies can have deep impacts on society and the environment, including some that were not anticipated. Analysis of costs and benefits is a critical aspect of decisions about technology.
Practices
- Using Mathematics and Computational Thinking
- Use mathematical models and/or computer simulations to predict the effects of a design solution on system and/or the interactions between systems.
- Constructing Explanations and Designing Solutions
- Evaluate a solution to a complex real-world problem, based on scientific knowledge, student-generated sources of evidence, prioritized criteria, and tradeoff considerations.
Discussion: Setting the Stage
In this activity you will examine:
- Q: What features in the schoolyard positively impact the health of the watershed?
- Q: What features in the schoolyard negatively impact the health of the watershed?
Discussion: Formative Questions
These will be used during the activity by the teacher to ask groups/students or whole class.
- Q: Based on information you learned in earlier units, how would you explain the difference in water quality scores between Forest and Grassland?
- Q: Why did you choose the CPs you did? Were there any CPs you removed? If yes, what were they and why?
- Q: How closely were you able to reproduce the forest and natural grassland scores?
Discussion: Wrapping Up
After completing this activity have the students answer the following questions:
- Q: Is there anything else you could do to reduce runoff and improve water quality on your schoolyard?
- A: have students list what conservation practices they proposed and why and what else could they have done. Why did they decide not to use some CPs? How much impact did they make when they compare the before and after runoff and water quality? Do they think they did enough? What were the most important considerations in their decision (cost, land area necessary, potentially eliminating some uses that the school needs/wants). How many versions did they design before they settled on the best one? Have the class review several (at least) to compare what different students/groups designed. Based on the variation, have them select aspects from each that they think would make the best overall plan.
Additional Background
- Teachers can provide students with a budget for conservation practices to modify their school yard.
Analysis
- Q: Calculate the percentage of increase and/or decrease for:
- Your schoolyard current conditions vs. forest
- Your schoolyard current conditions vs. natural grassland
- Your schoolyard current conditions vs. CPs
Further Investigation
At Home Activity
Choose a one square mile area in the watershed that you think has the most negative impact on the watershed. Using the Modify My Watershed tool, implement best management practices and land cover changes to maximize the watershed health of the area. Save your modifications on the Modify My Watershed site.
- Why did you choose your site to modify?
- Make a list of the features in the area that negatively impact the watershed?
- Classify the items on the list as naturally occurring or man-made.
- Make a list of the modifications you made.
- Which modification had the greatest impact on the watershed health?